
xG Betting Guide — Turning Expected Goals Into Actionable Edges
 Available in US
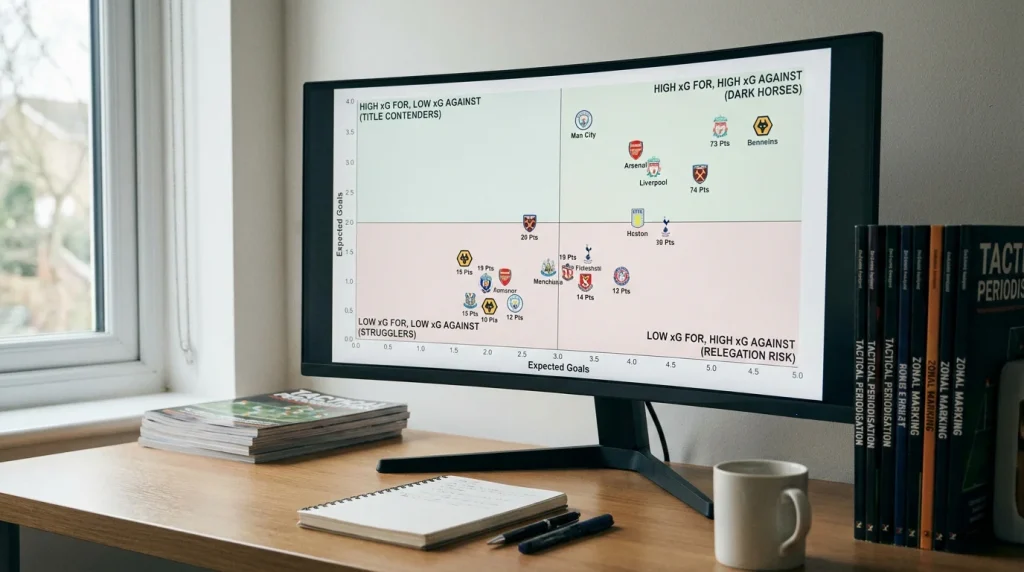
Expected Goals Changed How Sharp Punters Operate
I started using xG data in 2016, before most UK punters had heard the term. At the time, my edge came from spotting it early — bookmaker models had not fully integrated expected goals into their pricing, and the gap between xG-informed analysis and market odds was wide. That gap has narrowed considerably since then. The global AI-in-sports-betting market reached $10.8 billion in 2025 and is projected to exceed $60 billion by 2034 — and xG is one of the foundational metrics feeding those models. But narrower does not mean closed, and understanding xG remains one of the most important analytical skills a football punter can develop.

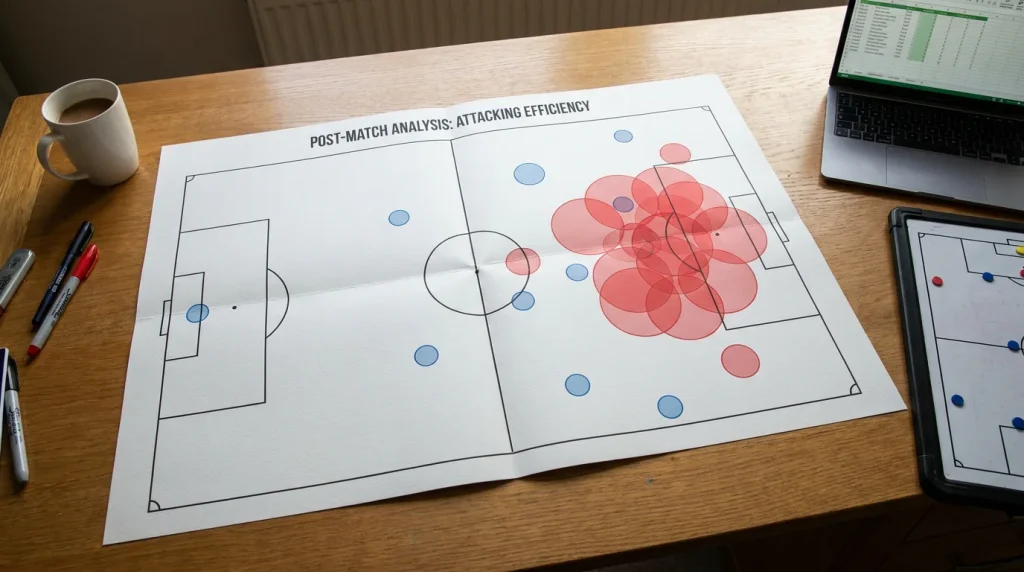
Expected goals quantifies the quality of chances a team creates and concedes. Rather than counting shots — a blunt instrument that treats a speculative 30-yard effort the same as a tap-in from three yards — xG assigns a probability to each shot based on historical conversion data for shots taken from similar positions, at similar angles, with similar game states. A shot from the centre of the six-yard box might carry an xG of 0.45. A shot from 25 yards at an angle might carry 0.03. Sum the xG for all shots in a match and you get a team’s expected goals for that game.
What xG Measures — and What It Misses
I had a conversation with a fellow punter last year who dismissed xG because “it does not account for who is taking the shot.” He had a point — and he was also wrong. Let me explain both sides.
Standard xG models assign probability based on shot location, angle, body part used, and whether the chance followed a cross, a through ball, a set piece, or open play. What they typically do not include is the identity of the shooter. A tap-in from three yards carries the same xG whether it falls to a clinical Premier League striker or a League Two defender who scores twice a season. That is a real limitation, and it means xG can overstate the chance quality for teams that create opportunities for weaker finishers and understate it for teams with elite finishing talent.
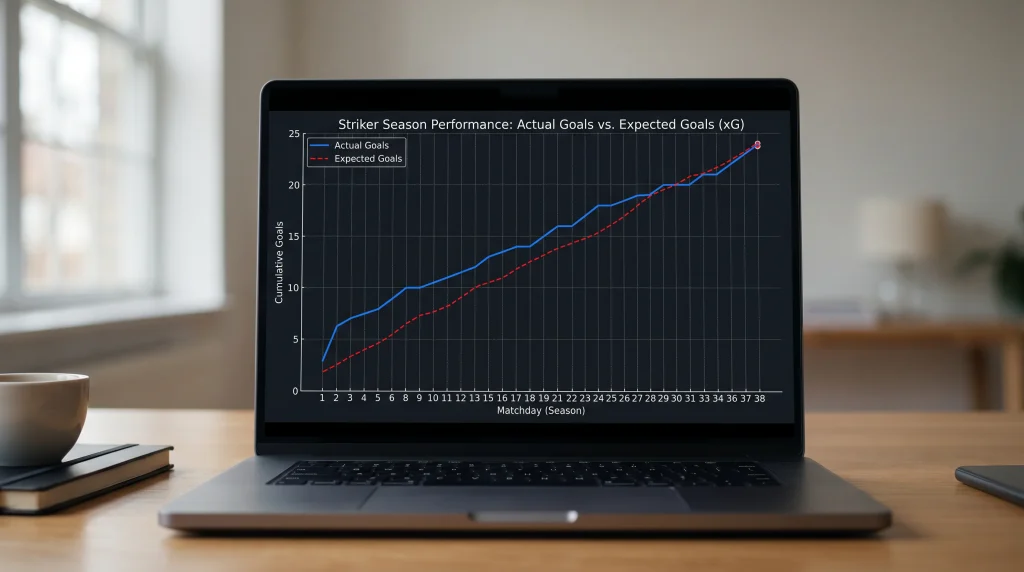
However — and this is the part my fellow punter missed — finishing quality regresses toward the mean more than most people assume. A striker who massively outperforms his xG in the first half of the season will, more often than not, score closer to his xG in the second half. The exceptions exist — there are genuinely elite finishers who consistently outperform xG year after year — but they are rare, and the market already prices for them. For the vast majority of players and teams, xG is a better predictor of future scoring than actual goals scored. Football is the UK’s most popular betting sport with 5.8% of the population placing wagers, and most of those punters look at the goals scored column rather than the xG column. That creates the edge.
What xG genuinely misses: shot-blocking before the shot is taken, goalkeeper positioning and quality, and tactical context like deliberate low-block defending that invites low-quality shots. These factors introduce noise, which is why I never use a single match’s xG in isolation. I work with rolling averages — typically the last eight to ten matches — to smooth out the variance and reveal the underlying trend.
xGA and PPDA — Defensive Metrics for Betting
Most punters who use xG focus on the attacking side — how many expected goals a team creates. The defensive side is equally important and, in my experience, more predictive for betting purposes.
xGA — expected goals against — measures the quality of chances a team concedes. A low xGA indicates a team that restricts opponents to low-quality shooting opportunities, which is a stronger defensive indicator than clean sheets alone. A team might keep a clean sheet despite conceding 1.5 xGA because the goalkeeper made exceptional saves — that is not sustainable. Conversely, a team might concede a goal despite allowing only 0.4 xGA — that is bad luck that will correct over time.
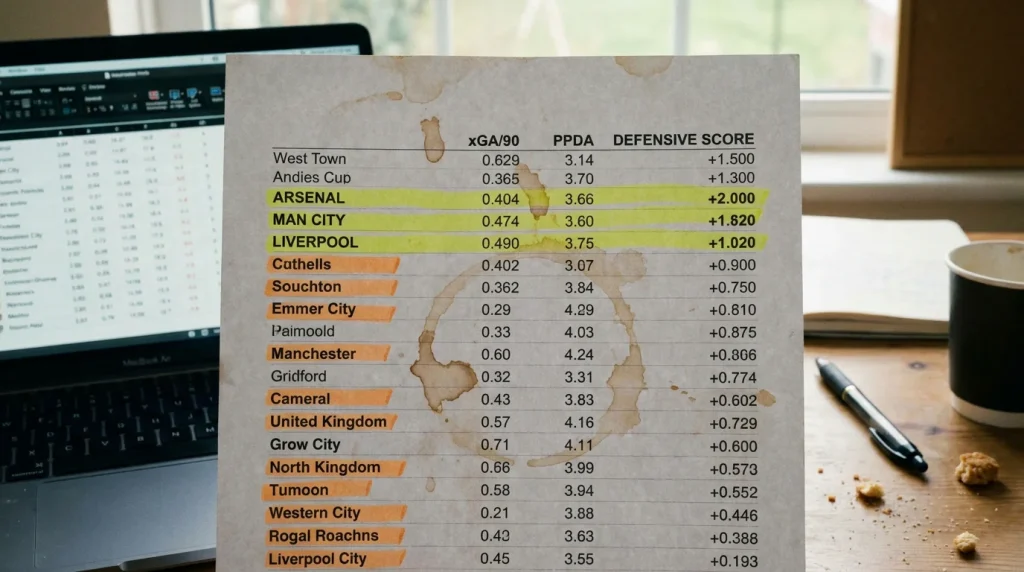
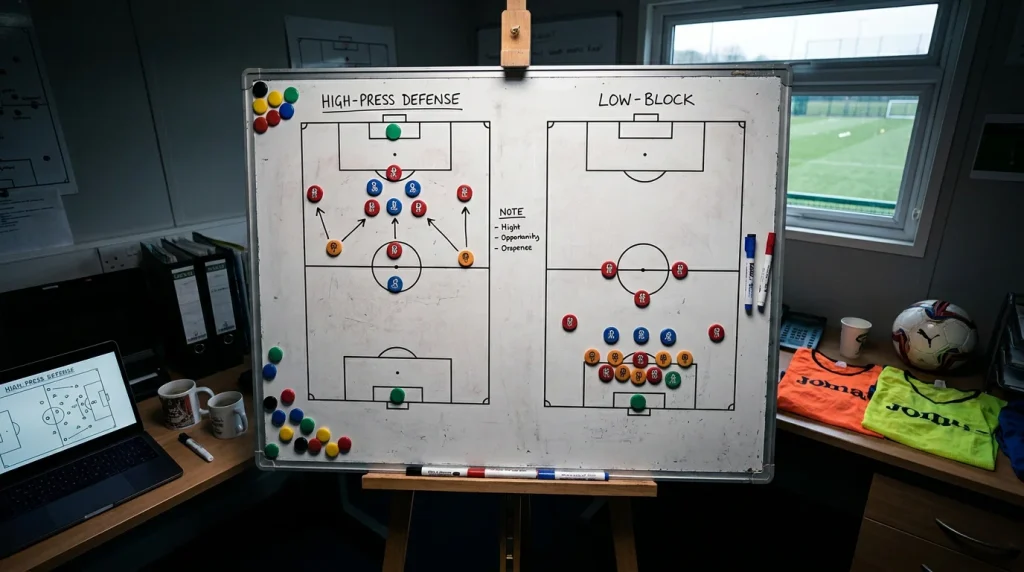
PPDA — passes per defensive action — measures how aggressively a team presses. A low PPDA means the team engages the opponent quickly after losing possession, typically in the opponent’s half. A high PPDA means the team sits deep and allows the opponent to build play before engaging. For betting, PPDA helps contextualise xG and xGA data. A team with low xGA and low PPDA is creating its defensive strength through active pressing — that is a process-driven outcome likely to persist. A team with low xGA and high PPDA is defending deep and relying on blocks and saves — that is more vulnerable to regression.
I combine these three metrics into a simple defensive quality score: xGA per match divided by PPDA, normalised against the league average. Teams that score well on this composite tend to sustain their defensive performance across a season, which makes them reliable anchors for under goals, clean sheet, and draw markets.
Applying xG to Match Result, BTTS and Totals Markets
The theory is elegant. The practical application is where most punters get stuck. Here is how I translate xG data into actual betting decisions across the three markets I use it for most.
For match result, I compare each team’s rolling xG and xGA to generate an expected scoreline. If Team A’s rolling xG is 1.7 and Team B’s rolling xGA is 1.5, I blend those to estimate Team A’s expected output in this specific fixture — typically a weighted average leaning toward the more recent data. Do the same for Team B’s expected output. Feed both estimates into a Poisson model and you get probabilities for home win, draw and away win. Compare those probabilities against the bookmaker’s implied probability and you have your value assessment.

For BTTS, I focus on xGA. If both teams concede 1.2+ xGA per match on a rolling basis, the probability of both teams scoring is high regardless of their attacking xG. Defensive weakness is a more reliable BTTS predictor than attacking strength because attacking output fluctuates more from match to match. With operators expanding into multi-product experiences to protect margins — as industry analysts have noted — the BTTS market is one that receives increasing bookmaker attention, so the edges are thinner but still present when both sides display defensive vulnerability in their xGA profiles.
For totals markets, I sum both teams’ estimated expected output for the fixture. If the combined estimate exceeds 2.8, I look at the over 2.5 goals price. If it sits below 2.2, I look at the under 2.5 price. The threshold is not fixed at 2.5 — it shifts based on the specific match context and the available odds. For a deeper dive into how xG interacts with other statistical metrics for betting, the football stats guide covers which numbers matter and which mislead.
Where can UK punters access free xG data?
Several platforms publish free xG data for major European leagues, including the Premier League, Championship, La Liga, Bundesliga and Serie A. These typically provide match-level and season-level xG, xGA and shot maps with weekly updates. Cross-referencing two sources helps smooth out model differences between providers.
How far back should xG samples go for reliable predictions?
I use rolling averages of the last eight to ten matches as my default window. Shorter samples — five matches or fewer — are too noisy and heavily influenced by individual outlier performances. Longer samples — full-season averages — dilute recent form and miss tactical or personnel changes. Eight to ten matches balances recency with statistical stability.
Articles
Written by the editors at Football Bet Today.
