
Football Betting Tips Today — Data-Driven Picks for Every Market
 Available in US
Sharp analysis. Smarter punts.

Why Data Beats Gut Instinct in Today's Football Markets
Three seasons ago, I backed a League Two side at 3.40 because "they looked due a win." They lost 4-0. The form table, the xG data, the away defensive record — everything screamed avoid. I just hadn't looked. That weekend cost me a chunk of my bankroll and handed me a rule I haven't broken since: if the numbers aren't there, the bet isn't there.
Football betting in the UK is no longer the casual Saturday afternoon punt it was a decade ago. The industry's gross gaming yield hit £16.8 billion in the year to March 2025, growing 7.3% year-on-year, and sports betting alone commands 57.1% of online gambling revenue. That kind of money attracts sharp operators, algorithmic pricing and a market that punishes lazy analysis.
UK gambling by the numbers: The remote casino, betting and bingo sector generated £7.8 billion in gross gaming yield in the financial year to March 2025. Of that, remote betting contributed £2.6 billion — with football alone accounting for £1.3 billion. Football isn't just the most popular sport to bet on; it is the market.

This guide is built around a single premise: data-driven analysis consistently outperforms gut instinct. I don't claim to have a crystal ball. What I do have is ten years of building pre-match models, reading expected goals data before it was fashionable, and tracking where bookmaker pricing slips. Every tip, every market breakdown, every worked example in these pages follows the same discipline — identify the edge, size the stake, manage the risk.
Whether you bet on match results, both teams to score, over/under goals, accumulators or bet builders, the framework stays the same. The markets change; the method doesn't. I've structured this guide to walk you through each major market with the numbers that matter, the traps that don't, and the practical steps that separate informed punting from expensive guesswork.
5.8% of the UK population bets on football. If you're one of them, you deserve better than recycled tips with no track record. Let's get into it.
Before diving into specific markets, it's worth understanding the sheer scale of the landscape you're operating in.
The Numbers That Shape Every Pick in This Guide
- UK football betting generates £1.3 billion in annual gross gaming yield — the single largest sport for remote operators. The market is deep, liquid and priced by sophisticated models.
- Over 70% of online sports bets are now placed in-play, making live-market discipline as important as pre-match analysis.
- Value betting — backing outcomes where your estimated probability exceeds the bookmaker's implied probability by at least 3 percentage points — is the only approach that compounds over time.
- The 2026 Remote Gaming Duty rise to 40% will squeeze margins, especially in lower-liquidity markets. Price-shopping across operators becomes non-negotiable.
- Bankroll discipline (1-2% flat staking) protects against variance. Without it, even a profitable model produces losses.
The UK Football Betting Landscape in Numbers
I remember the first time I pulled up Gambling Commission data properly — not a summary, not a press release, the actual quarterly report. The numbers were staggering. And every season since, they've grown. If you're placing football bets without understanding the market you're swimming in, you're a minnow that doesn't know the pool is full of sharks.
The UK online gambling market reached $9.0 billion in 2025, with projections pushing toward $13.2 billion by 2034. That growth isn't accidental. Mobile-first platforms, live streaming integration and the sheer depth of in-play markets have turned football betting into a round-the-clock operation. Around 290 million online bets on real events are placed every single month across UK platforms. Let that sink in — 290 million. Every month.
Football generates £1.3 billion in gross gaming yield annually for UK remote betting operators — more than horse racing, tennis and cricket combined.
What does this mean for you? It means bookmakers are not guessing. Their pricing models are fed by the same flood of data you can access — team form, expected goals, player availability, weather conditions, referee tendencies. The difference is they have quant teams and you have a laptop. The edge doesn't come from having more data. It comes from reading the data that the models underweight or the public ignores entirely.
Here's a number that changed how I approach every single bet: in-play wagers now account for more than 70% of online sports bets in the UK, up from less than 30% a decade ago. The pre-match market — the one most tipsters focus on — is the minority of activity. The live market is where the volume sits, where the pricing shifts fastest, and where disciplined punters find openings that pre-match odds have already priced shut.
The demographic picture matters too. Men bet on sport at nearly four times the rate of women — 15% versus 4% — and the 25-to-34 age bracket shows the highest engagement with gambling overall. This isn't abstract sociology. It tells you who the bookmaker is pricing for: young, male, emotionally invested football fans who bet with their hearts. If you can detach from that profile, you're already working from a different angle.
Putting scale into context
Suppose a Premier League match has a total handle of £5 million across UK operators. At a standard bookmaker margin of 5-8% on the 1X2 market, the operator expects to keep £250,000-£400,000 regardless of the result. Your job isn't to beat the bookmaker on every bet — it's to identify the 2-3% of markets where their margin is thinner than their model assumes. Over hundreds of bets, that sliver compounds.
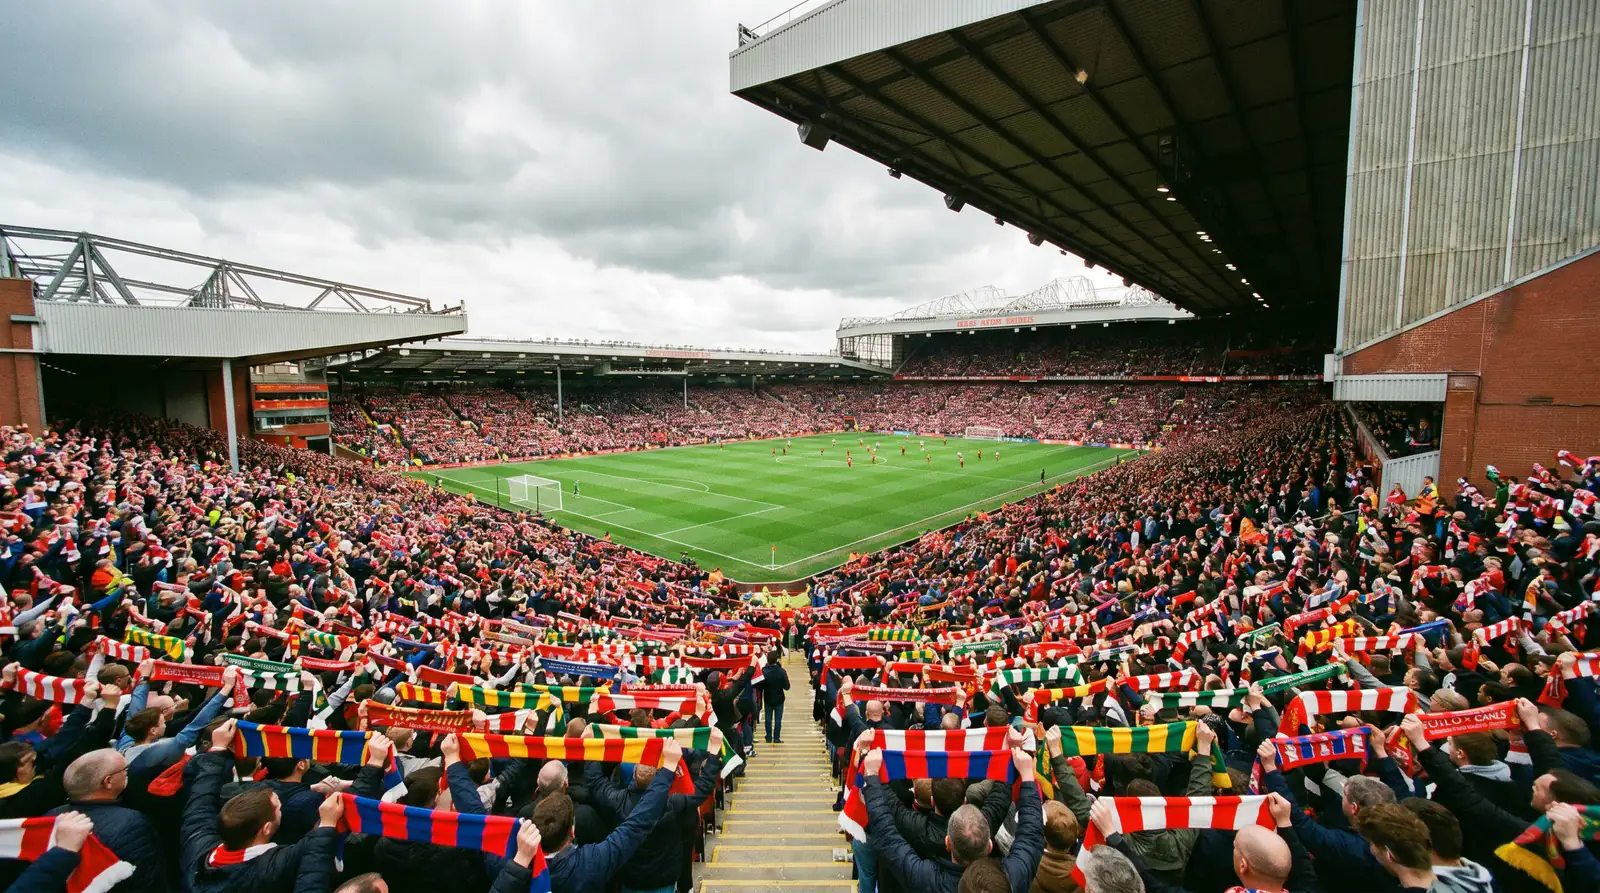
The tension between licensed operators absorbing tax hikes and unlicensed operators dodging them entirely filters down to the odds you see on your screen. As one industry analysis put it, "operators that expand into sports and multi-product experiences will be better positioned to protect margins and drive growth." Translation: bookmakers are diversifying to absorb costs, and some of those costs will land in your odds. A bet placed without knowing why the price is what it is — that's not a punt. That's a donation.
How Data-Driven Football Tips Are Built
A mate of mine once asked me to explain my process. I pulled up my spreadsheet and his eyes glazed over within thirty seconds. "Can't you just tell me who to back?" That's the gap between a tip and a method. Tips expire at full-time. A method keeps producing.
Every pick I publish follows the same five-stage pipeline. It starts with data collection — pulling expected goals, recent form over the last six to ten matches, head-to-head records and squad availability. I weight recent away form more heavily for visiting sides and home defensive form for the hosts. Raw results matter less than underlying performance indicators.
Expected goals (xG) — a metric that assigns a probability to every shot based on location, angle, body part and assist type. A team's xG total represents the number of goals they "should" have scored given the quality of their chances. It strips out finishing luck and reveals whether a side is over- or underperforming.
Stage two is model comparison. I run my own probability estimates for the three core outcomes — home win, draw, away win — and compare them against the bookmaker's implied probabilities. If my model gives a home win a 55% chance and the bookmaker's price implies 48%, that's a potential edge worth investigating. If the gap is inside 3%, I leave it alone. Margins that thin get eaten by the overround.
Implied probability — the real-world likelihood a bookmaker's odds suggest. Calculated as 1 divided by the decimal odds. If the price is 2.10, the implied probability is 1 / 2.10 = 47.6%. Because bookmaker odds include a margin, the implied probabilities for all outcomes in a market sum to more than 100%.
Stage three is context filtering. Numbers don't capture everything. A side chasing a Champions League spot in the final three weeks of the season behaves differently from the same side in a dead rubber. Managerial changes, derby intensity, fixture congestion from midweek European ties — these are the adjustments that separate a decent model from a useful one. I call them "override factors," and they account for roughly 10-15% of my final assessment.
Stage four is market selection. A match can look like a value home win on the 1X2 market but offer nothing on both teams to score. Or the goals line might be mispriced while the result market is razor-tight. I don't force a bet into a market — I follow the edge wherever the price gives it to me. Some days the edge is in corners or cards. Some days there's no edge at all, and the best play is no play. The final stage is stake sizing — but that's a discipline all its own, covered in detail later.
Worked example: identifying an edge on a Saturday fixture
Suppose Team A hosts Team B. My model estimates a home win probability of 58%. The bookmaker offers decimal odds of 1.85 on Team A, which implies a probability of 54.1% (1 / 1.85). The gap is 3.9 percentage points — above my 3% threshold.
I check context: Team A have no midweek fixture, their first-choice centre-back is fit again, and Team B are missing their primary creative midfielder. No override factor reduces my estimate. The bet qualifies.
I size the stake according to my bankroll rules — typically 1-2% of my total balance for a standard-confidence pick, rising to 3% only when the model gap exceeds 6%.

The global AI-in-sports-betting market hit $10.8 billion in 2025, projected to surpass $60 billion by 2034. That tells you how much money is pouring into predictive modelling. You don't need a neural network. You need a consistent process and the patience to trust it when individual results go sideways.
Match Result Tips — 1X2 Market Analysis
The 1X2 market is where most punters start, and where most punters lose their edge without realising it. I spent my first two years betting almost exclusively on match results. The strike rate was decent — around 52% — but the average odds were so low that the return barely covered the losses. It took a brutally honest spreadsheet review to see the problem: I was backing too many short-priced favourites where the bookmaker's margin was thickest.
Match result betting is the most liquid football market in the UK. That liquidity means tighter pricing on the headline games — the Saturday lunchtime kick-off, the Monday night fixture — but also means the bookmaker's model is at its sharpest. Where the edge hides is in the less glamorous fixtures: Tuesday night Championship matches, early-round cup ties, fixtures where one side's motivation is asymmetric.
Home Win
Strongest when host's home xG exceeds 1.5 per match and opponent's away defensive record is poor. Check for managerial bounce or new signing impact.
Draw
Underbet by the public. Most profitable in fixtures where both sides have low xG totals (under 1.2 each) and there is no significant form gap. Derby matches with defensive setups often produce stalemates.
Away Win
Value emerges when an away side's underlying metrics outstrip their league position — teams sitting mid-table but posting top-six xG numbers. Travel distance and fixture scheduling affect away performance measurably.
One pattern I've tracked consistently: newly promoted sides tend to be overpriced as underdogs in their opening eight to ten fixtures. The market assumes they'll struggle, but the momentum from winning promotion — combined with a packed home crowd — often produces results that defy the pre-season odds. By November, the market corrects. The window is narrow, but it's real.
Before placing any 1X2 bet, I run through a checklist that has saved me from more bad bets than any model ever has. It takes sixty seconds and it's non-negotiable.
1X2 pre-bet checklist
- Is my estimated probability at least 3 percentage points above the implied odds?
- Have I checked team news — confirmed, not rumoured?
- Is the fixture context neutral or favourable (no dead rubber, no post-European hangover)?
- Have I compared the price across at least three operators to ensure best available odds?
- Does the stake stay within my bankroll limit for this confidence tier?

If any answer is no, the bet doesn't go on. Discipline at the entry point is the cheapest insurance you'll ever buy.
Both Teams to Score — When the Numbers Say Yes
I once sat in a pub watching a 0-0 between two sides that had both scored in 80% of their previous ten matches. My BTTS accumulator died on the last leg. The bloke next to me said, "Both teams to score — it's basically a coin flip, isn't it?" It isn't. Not even close. And that misconception is exactly where the value lives.
Both teams to score — BTTS — is a binary market: either both sides find the net, or they don't. The beauty of it is that it strips away the result entirely. You don't care who wins. You care about defensive vulnerability and attacking output, which happen to be two of the most measurable dimensions in football analytics.
BTTS and the data underneath: The metrics that predict BTTS outcomes most reliably are xG conceded per match (xGA), clean-sheet percentage over the last ten fixtures, and shots-on-target conversion rate. A fixture where both sides post xGA above 1.2 and clean-sheet rates below 25% is a strong BTTS Yes candidate. When one side's clean-sheet rate climbs above 40%, BTTS No enters the picture — a market that many punters ignore entirely.

BTTS rates vary wildly across leagues. The Bundesliga consistently produces the highest rates in Europe's top five divisions, often exceeding 55% of fixtures. The Premier League hovers around 50%, while Serie A and Ligue 1 tend to sit lower due to more defensive tactical setups. If you're building BTTS picks without adjusting for the league's baseline rate, you're flying blind.
One trap I see constantly: punters stacking BTTS selections into accumulators without checking for correlation. If you've picked five matches where BTTS Yes lands at roughly 50% probability each, the combined probability of all five hitting is around 3.1% — not 50%. The accumulator's appeal is the big price. Its danger is that it flatters your optimism. I cover the correlation problem in depth in my football accumulator tips breakdown, including how to audit your acca legs for hidden dependencies.
For daily BTTS picks, I focus on fixtures where the gap between my estimated BTTS probability and the bookmaker's implied probability exceeds 5%. Anything tighter, and the margin eats the edge. A full walkthrough of the stats that drive both teams to score tips today — including league-by-league BTTS rates and clean-sheet indicators — is waiting in the dedicated guide.
BTTS is one side of the goals question. The other side — total goals — operates on overlapping but distinct data.
Over and Under Goals — Reading the Scoring Data
Every season, I run a simple backtest: what happens if you blindly bet over 2.5 goals in every Premier League fixture at average market odds? The result, year after year, is a slow bleed. Not catastrophic — you'll hit around 50-55% of the time — but the average price of roughly 1.80 means you need 56%+ just to break even. The market knows the baseline. Your job is to find the fixtures where the baseline is wrong.
The totals market — over/under goals — is one of the purest data-driven markets in football betting. It doesn't ask you to pick a winner. It asks a simpler question: will this match produce more or fewer goals than a threshold? The two most common lines are 2.5 and 1.5, though 3.5 and even 0.5 appear regularly on certain fixtures.
Five metrics consistently predict high-scoring fixtures: combined xG per match (both teams' attacking output added together), shots on target per game, average match tempo measured by passes into the final third, PPDA (passes allowed per defensive action, an indicator of pressing intensity), and head-to-head goal averages over the last five meetings. When three or more of these indicators point the same direction, the signal is strong.
Over 2.5 goals — reading the price
A bookmaker offers over 2.5 goals at 1.90 (implied probability 52.6%) and under 2.5 at 1.95 (implied probability 51.3%). The sum is 103.9% — the overround is 3.9%. If your model estimates over 2.5 at 58%, the edge is 58% - 52.6% = 5.4 percentage points. That's a bet. If your model says 54%, the edge is only 1.4 points — below margin. Pass.
Choosing the right line matters enormously. Over 1.5 goals hits in roughly 75-80% of Premier League matches but pays short odds — typically around 1.25-1.35. Over 3.5 hits only 25-30% of the time but pays 2.50+. The sweet spot depends on your strategy: high-strike-rate builders use 1.5 lines as accumulator foundations, while value hunters target 2.5 and 3.5 where the pricing is less efficient.
| Line | Typical Premier League hit rate | Typical odds range | Best used for |
|---|---|---|---|
| Over 1.5 goals | 75-80% | 1.25-1.35 | Accumulator foundation legs |
| Over 2.5 goals | 50-55% | 1.75-1.95 | Single bets and doubles where value gap exists |
| Over 3.5 goals | 25-30% | 2.40-2.80 | Selective value plays in high-xG fixtures |

The dedicated breakdown of over 2.5 goals tips today goes deeper into league-by-league scoring averages, first-half versus second-half goal clustering, and the specific contexts — derby matches, end-of-season dead rubbers — where the line moves in your favour.
Accumulator Tips — Correlation, Not Wishful Thinking
Let me tell you about the best accumulator I ever placed. It was a five-fold — four home wins and one draw — and it returned just under £400 from a £10 stake. Felt brilliant. Now let me tell you about the worst: a six-fold that missed by one leg seventeen times across two months. The emotional rollercoaster of near-misses is the accumulator's real product. Bookmakers know this. That's why they promote accas harder than any other bet type.
An accumulator multiplies the odds of each selection together, which means it also multiplies the bookmaker's margin on each leg. A four-fold where each leg carries a 5% overround doesn't carry a 5% combined margin — it's closer to 20%. The more legs, the bigger the house edge. This is the fundamental tension: accumulators offer life-changing returns, but the maths works relentlessly against you.
The correlation trap: Most accumulator builders treat their legs as independent events. They're not. If you pick three Premier League home wins on the same Saturday afternoon, those results are influenced by shared conditions — weather, referee pool, even the psychological ripple of early goals in televised matches. Correlated legs can either inflate or deflate the true combined probability. Ignoring correlation doesn't make it disappear. It just makes your pricing wrong.

Does that mean accumulators are a waste of money? No. It means they need to be built with the same analytical rigour as any other bet — arguably more, because the compounding margin demands a larger edge on each individual leg. I use a five-filter process for selecting acca legs: each selection must pass my probability threshold individually, the legs must be checked for correlation, the combined implied probability must sit below my model's combined estimate by at least 8%, the stake must be sized as a fun allocation (never more than 1% of bankroll), and the accumulator must contain no more than four legs. Beyond four, the maths becomes hostile.
Doubles and trebles — two- and three-leg multiples — offer a more sustainable way to capture the accumulator premium without the margin explosion. The dedicated accumulator guide lays out the correlation audit, the staking framework and a weekend workflow for building smarter accas from Saturday's full fixture list.
If accumulators combine separate matches, bet builders combine separate markets within a single match — a different beast entirely.
Bet Builder — Structuring Same-Game Multiples
When bet builders first appeared on UK platforms, I dismissed them as a gimmick — a flashy way to generate bigger prices by bolting random legs together. I was wrong. The bet builder is now one of the sharpest tools available to a data-driven punter, precisely because the bookmaker's pricing model for correlated same-game outcomes is less mature than their standalone market models.
A bet builder lets you combine multiple selections within a single match: match result, total goals, both teams to score, player to score, corners, cards, shots on target. The platform's algorithm prices the combined selection by estimating the correlation between legs. Here's the thing — those correlation estimates are often crude. A bookmaker knows that backing a home win and over 2.5 goals in the same match are positively correlated, but the degree of that correlation varies enormously by fixture profile. Their one-size-fits-all adjustment leaves gaps.
Result + Goals
The most common combination. Positively correlated — home wins in high-xG fixtures tend to produce more goals. Best when the home side's attacking output dwarfs the visitor's defensive quality.
Player Props + Corners
Lower correlation, often mispriced. A winger who takes corners and shoots from distance links two legs that the algorithm may treat as nearly independent. Research the player's role within the tactical setup.
Cards + Match Tempo
Card markets depend heavily on referee assignment. Check the appointed official's cards-per-game average over the current season, not career figures. Foul-rate data by team further sharpens the pick.

The step-by-step process for building a same-game multiple mirrors the standalone approach: estimate each leg's probability, assess correlation direction (positive or negative), compare your combined estimate against the offered price, and size the stake conservatively. Bet builders are inherently higher-variance than singles, so I cap them at the same 1% bankroll allocation I use for accumulators.
Online platforms now process over 290 million bets monthly in the UK, and bet builders account for a growing share of that volume. Their popularity means bookmakers are investing in better pricing — the window of mispriced correlation is narrowing season by season. My full football bet builder tips today walkthrough covers leg types, platform differences and a worked example from an actual Premier League fixture.
Premier League — Why the Top Flight Moves the Market
Last January, I ran a comparison across eight seasons of Premier League match-result odds versus the equivalent fixtures in the Championship. The average bookmaker margin on a Premier League 1X2 market was 4.2%. The Championship equivalent? 6.8%. The top flight attracts so much money that operators compete on price. For punters, that's a double-edged sword: better odds, but sharper pricing that leaves less room for error.
The Premier League is, by virtually every measure, the most heavily bet-on domestic football league in the world. It drives a disproportionate share of the £1.3 billion in football GGY generated by UK remote operators each year. That concentration of betting activity creates deep, liquid markets — but also means the bookmaker's probability estimates are refined by enormous volumes of money. Finding an edge here requires precision.
From the 2026/27 season, gambling logos will be banned from the front of Premier League match shirts — ending sponsorship deals worth a combined £129.6 million and reshaping the commercial relationship between football and betting.

Where value does emerge in the Premier League, it tends to cluster around specific situations: fixture congestion during the December-January schedule, newly promoted sides in their opening matches, and the final-day-of-season fixtures where motivation splits dramatically across the table. Squad rotation around European commitments — Champions League midweek, then a league match 72 hours later — produces measurable dips in performance that the market doesn't always price fully.
I've also tracked a persistent inefficiency around early-season pricing. Bookmakers anchor heavily on the previous season's finishing positions when setting their opening odds in August and September. Sides that have strengthened significantly in the transfer window or changed manager are frequently mispriced for the first six to eight matchdays. By October, the live data has corrected the model. That early window is where sharp punters get ahead.
The dedicated Premier League betting tips section covers weekly analysis: market efficiency, rotation patterns, home-away splits by table position and the specific impact of the incoming gambling sponsorship ban on how operators price the league's biggest fixtures.
Markets and leagues are the where. Value identification is the how — the mathematical backbone that turns an opinion into a quantified edge.
Spotting Value in Today's Football Odds
Here's a confession: the best bet I ever made lost. It was a League One match where my model gave the away side a 42% win probability, the bookmaker implied 31%, and I backed it at 3.20. The away side went down 1-0 to a 93rd-minute penalty. I was gutted — but I'd do it again tomorrow. That bet had an 11-point edge. Over a season of similar bets, the maths pays out. That single loss doesn't erase the logic. This is what separates value betting from result-chasing.
Value exists when the probability you assign to an outcome exceeds the probability implied by the bookmaker's odds. It's the only concept in football betting that genuinely compounds over time. Back enough positive-expected-value selections with disciplined staking, and the long-run trend tilts in your favour — even if individual bets lose more often than they win.
Overlay — a situation where the bookmaker's odds imply a lower probability than the true likelihood of the outcome. If a fair price for an event is 2.00 (50%) and the bookmaker offers 2.30 (43.5%), the overlay is 6.5 percentage points. The punter is being paid above the true odds.
The maths is straightforward. Convert the decimal odds to implied probability. Compare against your estimated probability. If your number is higher, you have a candidate. If the gap exceeds the bookmaker's margin on that market — typically 3-8% depending on the league and market type — you have a value bet.
Edge calculation in practice
Decimal odds: 2.40. Implied probability: 1 / 2.40 = 41.7%. Your model's probability: 48%. Edge: 48% - 41.7% = 6.3 percentage points. Expected value per £1 staked: (0.48 x £1.40) - (0.52 x £1.00) = £0.672 - £0.520 = +£0.152. For every pound staked, the long-run expectation is a 15.2p profit.
Now here's the part that most value-betting guides leave out: the tax environment affects where value hides. The Remote Gaming Duty rose to 40% in April 2026, with a new 25% remote betting duty arriving in April 2027. Helen Rhodes, the Gambling Commission's Director of Major Policy Projects, acknowledged the surrounding debate, noting that "there has been a lot of recent commentary about financial risk assessments and sadly much of it has been ill-informed or inaccurate." The government expects operators to pass up to 90% of the duty increase on to consumers. That pass-through squeezes margins most in lower-liquidity markets — Championship, League One and niche European fixtures — where the bookmaker has less competitive pressure to hold prices.
+EV (positive expected value) — a bet where the mathematical expectation, calculated over infinite repetitions, yields a profit. A +EV bet can still lose on any single occasion. The concept only works with sufficient sample size and consistent staking discipline.
Full value assessment — weekend fixture
Step 1: Estimate the probability using your model. Team A at home: 52% to win.
Step 2: Check the best available odds across operators. Best price: 2.05 (implied probability 48.8%).
Step 3: Calculate the edge. 52.0% - 48.8% = 3.2 percentage points. Above the 3% threshold — qualifies.
Step 4: Assess context. No override factors apply. Fixture context neutral.
Step 5: Size the stake. Standard 1.5% of bankroll for a 3-4 point edge. If the bankroll is £1,000, the stake is £15.
Step 6: Place the bet at the best available price. Log the bet with your estimated probability, the odds taken and the stake.

Value isn't exciting. It doesn't produce the viral screenshot of a 50/1 winner. What it produces is a rising equity curve over hundreds of bets — and that's worth infinitely more than one lucky night.
In-Play Betting — The 70% Factor
I used to avoid in-play betting entirely. The speed of it made me uncomfortable — odds shifting every thirty seconds, the temptation to chase a losing pre-match position, the emotional pull of watching a match and feeling like you "know" what's about to happen. Then I looked at the data. More than 70% of all online sports bets in the UK are now placed in-play. The market I was ignoring was the market. So I built rules around it.
The live-betting shift: A decade ago, in-play wagers accounted for less than 30% of online sports bets. Today that figure exceeds 70%, driven by mobile platforms, live streaming and granular market depth. Online platforms command 78.47% of total UK sports betting revenue, and the in-play segment is the fastest-growing slice within that.
In-play betting offers genuinely different edges from pre-match. Goals, red cards, injuries and tactical substitutions create real-time information that the bookmaker's algorithm reprices within seconds. But "within seconds" is not "instantly." The gap between event and repricing — particularly on less liquid markets like corners, cards and next goalscorer — is where a prepared punter finds an opening.
My live-betting triggers are specific: I enter a position when a side's live xG accumulation exceeds their current scoreline by more than 0.8 goals (suggesting they're dominating chances without converting), when a clear tactical shift occurs (a substitution that moves a midfielder to a wing-back role, for example), or when a red card changes the match state in a direction the market hasn't fully absorbed. I don't bet live on impulse. Every entry follows a pre-written scenario that I've identified before kick-off.
Cash-out caution: The cash-out function is priced in the bookmaker's favour — always. The offered cash-out value is lower than the theoretical value of your open position. I use it only when the match state has changed so fundamentally (injury to a key player, radical tactical shift) that my original thesis is invalidated. Cashing out because you're "nervous" is paying a premium for an emotion.

Live betting rewards preparation and punishes reaction. If you're entering positions because the commentator's voice got excited, you're not betting — you're gambling. The distinction matters. Build your scenarios before the whistle, execute when the conditions match, and walk away when they don't.
Staying Sharp — Bankroll Discipline and Responsible Staking
Four years ago I hit a losing streak that lasted three weeks. Fourteen consecutive losing bets. My model was sound — the backtested edge was still positive — but the short-run variance was savage. On day fifteen I sat down to place the next bet and noticed my hands were tense. My jaw was clenched. I wasn't thinking about the edge anymore. I was thinking about "getting it back." I closed the laptop and didn't bet for a week. That decision probably saved my bankroll.
Bankroll discipline is not a footnote. It is the structural foundation beneath every tip, every model and every edge discussed in this guide. Without it, a profitable method produces losses — because the punter's behaviour overrides the maths.
The youth dimension: 30% of young people in the UK gambled in 2025, up from 27% the previous year. Tim Miller, then Executive Director of Research and Policy at the UK Gambling Commission, noted that the increase wasn't driven by underage encouragement but by "increased participation in gambling that is either legal or does not require regulation, such as private betting between friends." 49% of young people encounter gambling advertising weekly through social media. These figures are a reminder that responsible staking isn't just a personal discipline — it's a cultural one.
I use a flat-staking approach for the bulk of my bets: 1-2% of my total bankroll per selection, regardless of confidence level. The only exception is the rare 3% stake when the model gap exceeds 6 percentage points — and even then, the cap is strict. Kelly Criterion optimises growth rate mathematically but amplifies variance in practice; I find it more useful as a theoretical ceiling than a day-to-day sizing tool.
Bankroll discipline checklist
- Is my total exposure today under 5% of my bankroll?
- Am I betting because the data supports it — or because I want to recover a loss?
- Have I logged every bet this week with probability estimate, odds and outcome?
- Would I be comfortable showing this bet slip to someone I respect?
- Have I set a stop-loss for the session — a point where I close the app regardless?

If betting stops being enjoyable, or if the staking starts creeping above your limits, those are signals — not to push harder, but to pause. The UK has robust support infrastructure: deposit limits, cooling-off periods, self-exclusion through GamStop. Using them isn't weakness. It's the same data-driven discipline applied to your own behaviour instead of a football match. Recognise the pattern, act on the evidence.
World Cup 2026 — What the Betting Market Expects
When the 2022 World Cup kicked off in Qatar, I watched the outright market move more in three days than it had in the preceding six months. Group-stage upsets — Saudi Arabia beating Argentina, Japan toppling Germany — ripped through the futures prices and created a secondary wave of value in the match-by-match markets. Tournaments are chaos engines, and the 2026 edition is shaping up to be the biggest yet.
The projected total betting volume for the 2026 World Cup is $36.9 billion, with an estimated 12.3 million new betting accounts expected to open worldwide. The 2022 tournament generated approximately $35 billion — and 30% of fans following the 2026 event plan to wager more than they did last time.
The 2026 tournament introduces a 48-team format across three host nations — the United States, Canada and Mexico. That expansion changes the betting landscape in measurable ways. More group-stage matches means a larger sample of fixtures in a compressed timeframe. More mismatches in the early rounds — top-tier sides against qualifiers from weaker confederations — create a different pricing environment from the traditional 32-team structure. The outright market will be wider and the group-stage odds on heavy favourites will be shorter, which pushes value seekers toward match props, totals and correct-score markets.
Host-nation advantage is a documented factor in World Cup history, but a tri-host tournament dilutes it. Travel distances between venues, altitude differences between Mexican highland stadiums and sea-level Canadian cities, and time-zone adjustments all become variables that the standard bookmaker model may underweight. I'll be building a dedicated pre-tournament model that incorporates squad valuations, qualification form and logistical factors — something the market tends to flatten into a single "home advantage" coefficient.
Early outright betting is already open, and the prices will shift significantly between now and the opening match in June 2026. The value question isn't whether to bet on the World Cup. It's when, and on which markets, the mispricing is widest. I'll be tracking that in real time as the tournament approaches.
Frequently Asked Questions
What are the most profitable football betting markets in the UK?
No single market is universally "most profitable" — profitability depends on your analytical edge. In my experience, the totals market (over/under goals) and the BTTS market offer the most consistent opportunities because they rely on quantifiable defensive and attacking metrics rather than predicting a winner. Lower-league fixtures — Championship, League One — tend to have wider bookmaker margins but also greater mispricing due to thinner data coverage. The key is matching your analytical strengths to the market where your probability estimates diverge most from the bookmaker's implied odds.
How do professional tipsters use expected goals to find value?
Expected goals — xG — tells you how many goals a team "should" score based on shot quality, stripping out finishing variance. Professional analysts compare a team's xG output over the last six to ten matches against the bookmaker's implied goal expectancy for an upcoming fixture. If a side's xG per game is 1.8 but the market prices them as though they'll produce 1.3 goals, there's a gap worth investigating. xG also identifies overperformers (teams scoring above their xG, likely to regress) and underperformers (teams due a correction upward).
Are football accumulator tips worth following long-term?
Over the long run, accumulators carry a structural disadvantage: the bookmaker's margin compounds with each added leg. A four-fold with a 5% overround per leg has an effective combined margin near 20%. That said, well-constructed doubles and trebles — where each leg has been individually assessed for value and the legs are checked for correlation — can be profitable. The crucial factor is staking discipline: accumulators should represent a small, fixed percentage of your bankroll, treated as high-variance plays rather than the core of your betting strategy.
What bankroll management strategy works best for football betting?
Flat staking — risking a consistent 1-2% of your total bankroll per bet — is the simplest and most resilient approach. It protects against losing streaks, which are inevitable even with a genuine edge. The Kelly Criterion offers mathematically optimal sizing based on your estimated edge, but it requires very accurate probability estimates and produces volatile swings. Most successful punters I know use a modified flat-staking approach with a small flexibility band: 1% for standard bets, up to 3% for high-confidence selections where the model gap exceeds 6 percentage points. The non-negotiable rule: never chase losses by increasing stake size.
How do in-play odds shift during a football match?
In-play odds are driven by the match state — scoreline, time elapsed, red cards, momentum — and repriced algorithmically in near-real-time. A goal typically triggers the most dramatic shift: the scoring side's match-result price shortens sharply while the opposition's drifts. Over 2.5 goals odds compress as the match progresses goallessly, then collapse when a goal lands. The most interesting movements happen around events the algorithm reprices slowly: tactical substitutions, injuries to key players, or a shift in pressing intensity that hasn't yet produced a shot on target. Those windows — measured in seconds to minutes — are where prepared live bettors find edges.
Is online football betting legal in the UK?
Yes. Online football betting is fully legal in the UK for adults aged 18 and over, provided you use an operator licensed by the UK Gambling Commission. Licensed operators are required to adhere to strict regulations around consumer protection, fair pricing and responsible gambling tools. Unlicensed offshore operators exist, but using them carries significant risks — no regulatory recourse, no deposit protection, and no guarantee of fair odds. Always verify that the operator displays a valid Gambling Commission licence number before opening an account.
How will the 2026 Remote Gaming Duty increase affect betting odds?
The Remote Gaming Duty rose from 21% to 40% in April 2026, with a new 25% remote betting duty set for April 2027. The government expects operators to pass up to 90% of the increase on to consumers. In practice, this means slightly wider margins on betting markets — particularly in lower-liquidity fixtures where competitive pressure is weakest. You're unlikely to see headline odds on a Premier League match change dramatically, but the margins on niche markets — lower-league fixtures, player props, correct score — will tighten. Shopping across multiple operators for the best available price becomes even more important in a higher-duty environment.
Articles
Published by the Football Bet Today team.
