
Football Corners Betting — a Peripheral Market With Structural Edges
 Available in US
Corners — the Market Bookmakers Price as an Afterthought
I discovered corners betting the same way most punters do — as an additional market tacked onto a match I was already watching. A mate suggested “over 10.5 corners” on a Premier League fixture, I checked the price, thought it looked reasonable, and placed the bet without any real analysis. It won. The next three corner bets I placed the same way all lost. That cycle of uninformed wins followed by uninformed losses is the corners market in miniature for most punters — gambling, not betting.
Then I started treating corners the way I treat match result: with data, a model, and a systematic approach. The results changed immediately. Corners markets are among the most inefficiently priced in UK football betting because they sit outside the bookmaker’s core pricing focus. The remote betting sector generated GBP 2.6 billion from sports in the year to March 2025, and the overwhelming majority of that money lands on match result, totals, and goalscorer markets. Corners absorb a tiny fraction of the volume, which means the bookmaker allocates proportionally fewer resources to pricing them accurately. That resource gap is your opportunity.
What Drives Corner Counts — and What Does Not
Most punters assume that attacking teams win more corners. The relationship is weaker than you think. What actually drives corner counts is a combination of attacking style, defensive shape, and the interaction between the two.
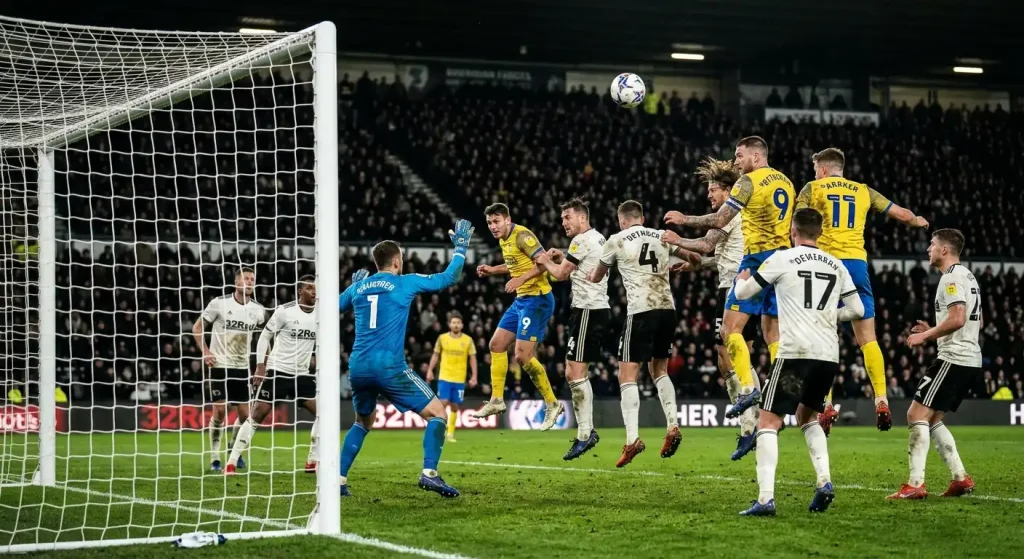
A team that attacks through wide areas — wingers who take on full-backs, overlapping runs, crosses into the box — generates corners at a higher rate than a team that attacks centrally through short passing combinations. The reason is mechanical: wide attacks produce deflections, blocks, and saves that go out for corners. Central attacks produce goals, saves held by the goalkeeper, or turnovers that stay in play. I track each team’s attacking width — measured by the proportion of their final-third entries that come through wide zones versus central zones — as the primary input for my corners model.

The defensive side is equally important. A team that defends with a compact, narrow block forces the opposition wide, which increases the likelihood of crosses being blocked for corners. A team that defends with a high line and aggressive pressing wins the ball back in midfield more often, reducing the number of attacks that reach the wide areas where corners are generated. When a wide-attacking team faces a narrow-block defence, the corner count tends to spike well above the league average. The roughly 290 million online bets placed monthly across UK markets include a growing share of corners bets, but the analytical approach most punters bring to this market — checking the league average and guessing — misses these matchup-specific dynamics entirely.
Total Corners Lines — Where the Value Sits
The standard corners market is an over/under line, typically set at 9.5 or 10.5 for a Premier League fixture. The bookmaker sets this line based on the season average for the two teams involved, adjusted slightly for home/away splits. That adjustment is crude, and the crudeness is exploitable.
My model generates a corner-count estimate for each fixture by combining four inputs: home team’s average corners won (home matches only, last eight games), away team’s average corners won (away matches only, last eight games), the attacking-width metric for each team, and the defensive-block-shape metric for each team. The first two inputs give me a baseline. The second two adjust that baseline for the specific matchup dynamics that drive corner production above or below the average.
The bookmaker’s line tends to gravitate toward the combined season average of the two teams, which is a reasonable but imprecise estimate. My matchup-adjusted estimate diverges from the bookmaker’s line by more than 1.5 corners in roughly 25-30% of fixtures. When the divergence exceeds 1.5, the over or under price typically offers genuine value. I have tracked this approach across three Premier League seasons and the return has been consistently positive — not spectacular, but steady, which is what you want from a market you bet on 8-12 times per week.
Team Corners and Asian Corner Handicaps
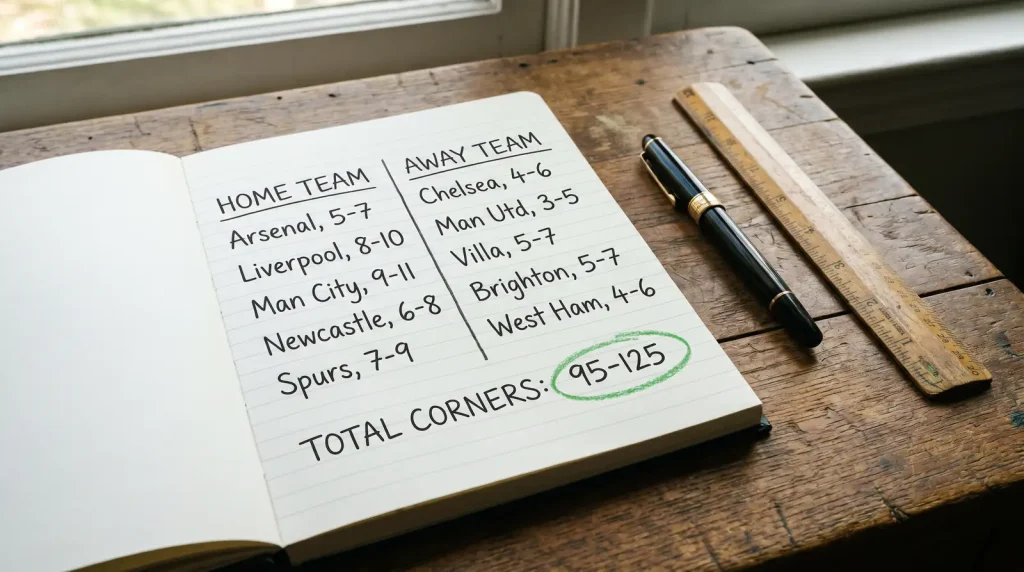
Beyond the total corners market, team-specific corner markets offer another layer of opportunity. Some bookmakers price individual team corners — over/under on how many corners Team A will win in the match. The overround on these markets is higher than on totals, but the pricing is also less precise because the bookmaker is estimating a single team’s corner production rather than the combined output of both sides.
I find the strongest edges in team corners when one team has an extreme profile — a side that averages 7+ corners per home match due to a wide-attack-heavy system, or a side that averages fewer than 3 corners per away match because they play through the centre exclusively. These extremes are stable over 8-10 match samples and they diverge from the bookmaker’s line more frequently than the overall totals.
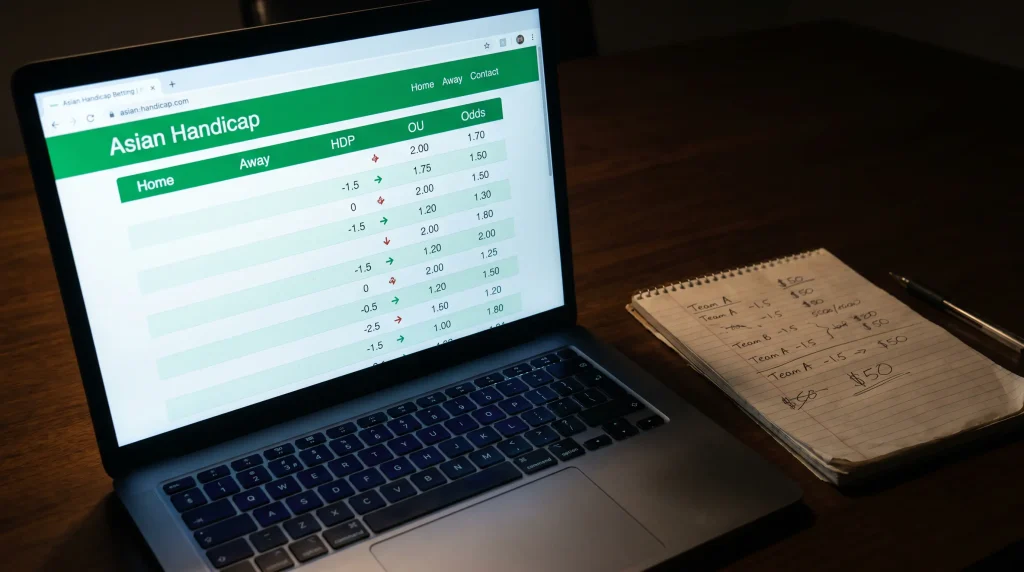
Asian corner handicaps function identically to Asian goal handicaps — one team receives a virtual corner head start and the market is priced as a two-outcome bet. The margins on Asian corner handicaps are tighter than on standard corners markets because the Asian handicap format attracts more sophisticated bettors who demand competitive pricing. For punters already comfortable with Asian handicaps on match results, applying the same framework to corners is a natural extension. Online platforms account for 78.47% of UK sports betting revenue, and the corner-specific data available through those platforms — team corner averages, match-by-match corner logs, corner timing distributions — makes the analysis accessible without any specialist tools. For a detailed breakdown of how Asian handicap mechanics work across different markets, the Asian handicap guide covers the structure from quarter-lines to full goals.
What is the most important factor in predicting total corners in a football match?
The interaction between attacking style and defensive shape is more predictive than either team"s raw corner average. A wide-attacking team facing a narrow-block defence produces significantly more corners than two teams that play centrally. I track attacking width and defensive block shape as primary model inputs alongside rolling corner averages, and the matchup-adjusted estimate outperforms the simple average in roughly 70% of fixtures.
Are corners markets less efficiently priced than match-result markets?
Yes. Corners markets attract a fraction of the betting volume that match-result markets receive, which means bookmakers allocate fewer pricing resources and apply less manual oversight. The average overround on a corners total market is typically 106-110%, compared to 103-106% on match result. The wider margin and lower scrutiny create more frequent and larger pricing errors, particularly when matchup-specific dynamics diverge from simple team averages.
Articles
Published by the Football Bet Today team.
