
Correct Score Predictions Today — How Probability Models Pick Scorelines
 Available in US
Why Correct Score Pays Big — and Loses More Often
I placed my first correct score bet in 2014 on a 2-1 home win in a Championship midweek fixture. The odds were 7/1 and it landed. What followed was a three-month losing streak on the same market that wiped out that win and then some. That is the correct score market in a single anecdote — the payouts look gorgeous on paper, but the hit rate is brutally low, and most punters underestimate just how brutal.
The reason is arithmetic. A standard 1X2 market splits outcomes into three buckets. The correct score market splits the same 90 minutes into dozens of possible scorelines — 0-0, 1-0, 0-1, 1-1, 2-0, 2-1, and so on through to 4-4 and beyond. Football generates roughly 5.8% of the UK population placing bets on the sport each year, making it the most wagered-upon discipline in the country, yet only a tiny fraction of those punters consistently profit from correct score markets. The maths demands precision that gut instinct cannot deliver.
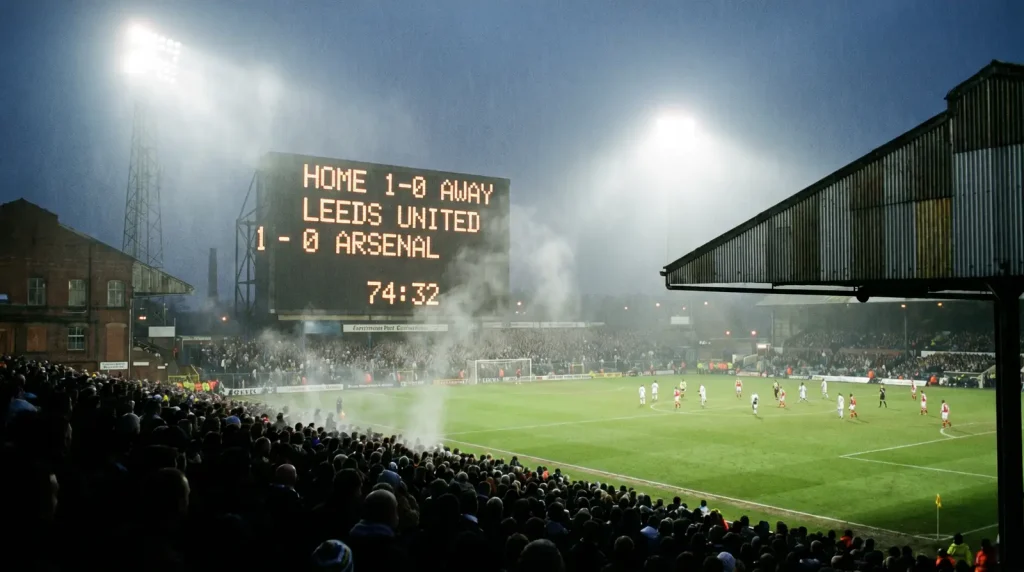
A typical Premier League match has somewhere between 15 and 25 realistic scoreline outcomes. Bookmakers price each one individually, and the combined overround on a correct score market is often north of 140% — far higher than the 105-110% you will find on a match result market. That margin is your enemy, and it means you need a genuinely robust method to find any edge at all.
So why bother? Because the payouts compensate. A 1-0 result might sit at 6/1. A 2-1 at 7/1. A 0-0 at 9/1 or higher. When you can attach a credible probability estimate to a scoreline and compare it against the bookmaker’s implied probability, the gap — if one exists — is worth far more per bet than anything you will find in match result or totals markets. The challenge is building that estimate honestly.
Poisson Distribution Applied to Football Scorelines
Every serious correct score model I have built over the past decade starts in the same place: the Poisson distribution. It sounds academic, but the core idea is straightforward. If you know the average number of goals a team scores per match and the average number they concede, you can calculate the probability of them scoring exactly 0, 1, 2, 3 or more goals in a single game. Multiply the home team’s goal probability by the away team’s goal probability for every possible combination and you get a probability grid for every scoreline.

Here is how that works in practice. Suppose the home side averages 1.6 goals scored per match and the away side averages 1.1 goals scored per match. Using Poisson, the probability of the home team scoring exactly 1 goal is about 32.3%. The probability of the away team scoring exactly 0 goals is about 33.3%. Multiply those together and you get roughly a 10.8% chance of a 1-0 home win. If the bookmaker prices 1-0 at 7/1 — implying a 12.5% probability — then the bookmaker’s price is shorter than your model’s estimate, meaning no value. But if 1-0 is priced at 11/1 — implying 8.3% — your model says 10.8% and there is a potential overlay of about 2.5 percentage points.
The formula itself is P(x) = (lambda^x * e^-lambda) / x!, where lambda is the expected goals average and x is the exact number of goals. You do not need to compute this by hand. A spreadsheet handles it in seconds, and there are free Poisson calculators available online. What matters is the input quality — your lambda values. Using raw season-long averages is a start, but I get better results weighting the last six to eight matches more heavily, adjusting for home and away splits, and factoring in opponent strength. A team averaging 1.6 goals per match across the season might average 2.1 at home against bottom-half sides and 0.9 away against the top six. Context sharpens the model.

Poisson has limitations. It assumes goals are independent events, which is not entirely true — a team going 1-0 down changes the match dynamic. It also struggles with very low-scoring or very high-scoring fixtures at the extremes. But across hundreds of matches, it remains the most reliable starting framework for correct score estimation. I treat it as the foundation, not the finished product.
Narrowing the Grid — Which Scorelines to Target
A full Poisson grid might give you probabilities for 30+ scorelines. Most of those probabilities are tiny — under 3% — and betting on them is essentially lottery territory. The skill is in narrowing the grid to a handful of scorelines where your model’s probability meaningfully exceeds the bookmaker’s implied probability.
I typically focus on scorelines between 0-0 and 3-2 in either direction. That covers the realistic range where data is dense enough to be useful. With roughly 290 million online bets placed monthly across UK sports markets, the correct score segment is a small but liquid slice — bookmakers pay attention to it, but they also rely on standard models that can lag behind form shifts.

My process runs in three stages. First, generate the Poisson grid using adjusted lambdas. Second, convert every bookmaker price on the correct score market into an implied probability. Third, compare. I am looking for scorelines where my model says the probability is at least 15-20% higher than the bookmaker’s implied price. Anything smaller than that and the overround eats the edge.
One pattern I have noticed repeatedly: bookmakers tend to underprice draws in low-scoring fixtures. A 0-0 or 1-1 in a match between two defensively solid sides is often available at odds that imply a lower probability than my model suggests. This makes sense — punters overwhelmingly back winners, not stalemates, so the money flow pushes draw scoreline prices out slightly. That is where I find the most consistent value in this market. If you are interested in how draw dynamics work more broadly, there is a dedicated breakdown in the draw predictions guide.
Correct Score Doubles — Compounding Edge or Risk
Last winter I hit a correct score double — 1-0 in the early kick-off combined with 2-1 in the late game — at combined odds just north of 80/1. It felt like genius at the time. Looking back at my records, that double came after 47 consecutive losing correct score doubles. The net position over that run was slightly negative.
Correct score doubles multiply the challenge. You need two low-probability events to land in the same coupon. The combined probability of two scorelines each at, say, 10% is 1%. Even if you have identified genuine value on both legs individually, the compounding effect of variance means you need a very large sample size before the edge materialises in your actual returns.
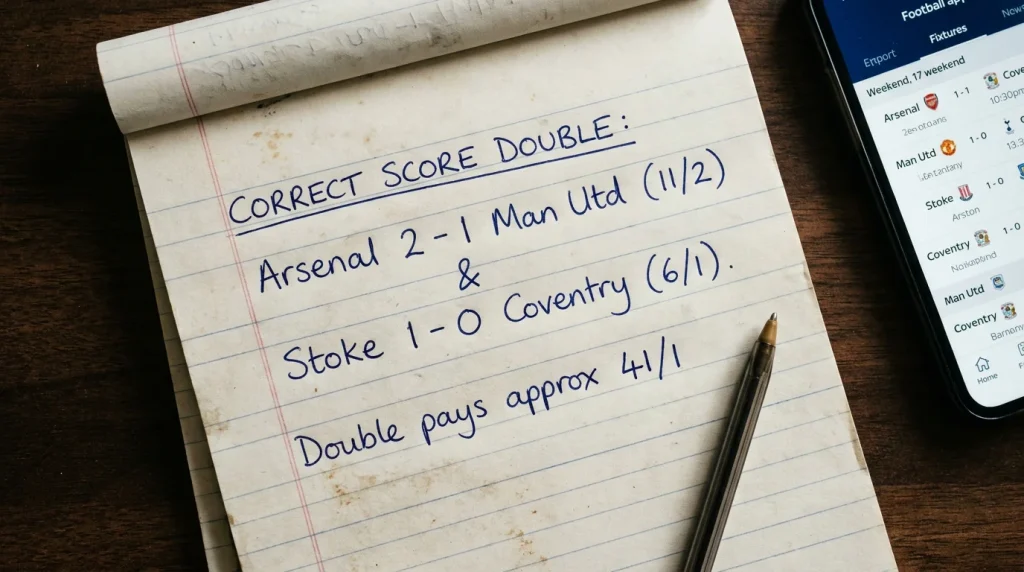
I am not saying avoid them entirely. If your Poisson model identifies value on two independent fixtures and the individual edges are strong — north of 20% above implied probability — a double is mathematically justified. But the staking must reflect the volatility. I never put more than 0.5% of my bankroll on a correct score double, and I treat any return as a bonus rather than an expected income stream. The singles are where the real, grindable edge lives in this market.
The discipline question is whether you can stomach 40, 50, even 60 losing bets before the variance corrects. Most recreational punters cannot, and that is perfectly rational — life is too short to spend it watching correct score doubles miss by a single goal week after week. If that describes you, stick to correct score singles on the highest-conviction selections your model produces, keep the stakes small, and let the maths work over months rather than days.
How accurate are Poisson-based correct score predictions?
Poisson models typically estimate scoreline probabilities within 1-3 percentage points of observed frequencies across large samples. They are most accurate for scorelines in the 0-0 to 3-1 range and less reliable at extremes. Accuracy improves significantly when input lambdas are adjusted for home-away splits, opponent strength and recent form rather than using raw season averages.
Is a correct score double ever a smart bet?
A correct score double is mathematically justified only when your model identifies genuine value on both legs independently and the combined edge exceeds the additional variance cost. Even then, stakes should be minimal — no more than 0.5% of bankroll — because the hit rate is extremely low and long losing runs are inevitable before variance corrects.
Articles
Published by the Football Bet Today team.
