
Draw Predictions Today — Finding Value in Football's Most Ignored Result
 Available in US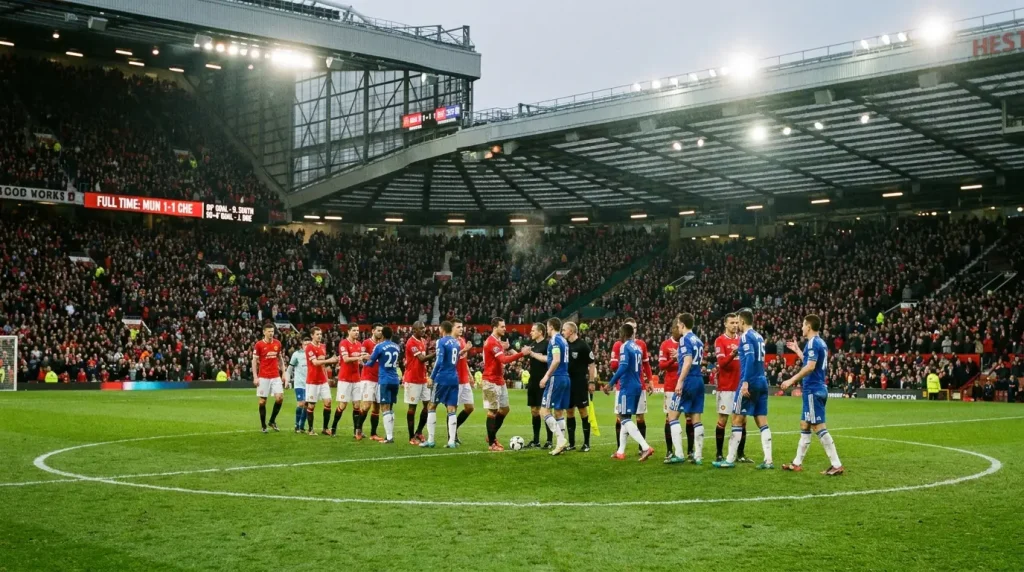
The Draw — Underbet, Overpriced and Overlooked
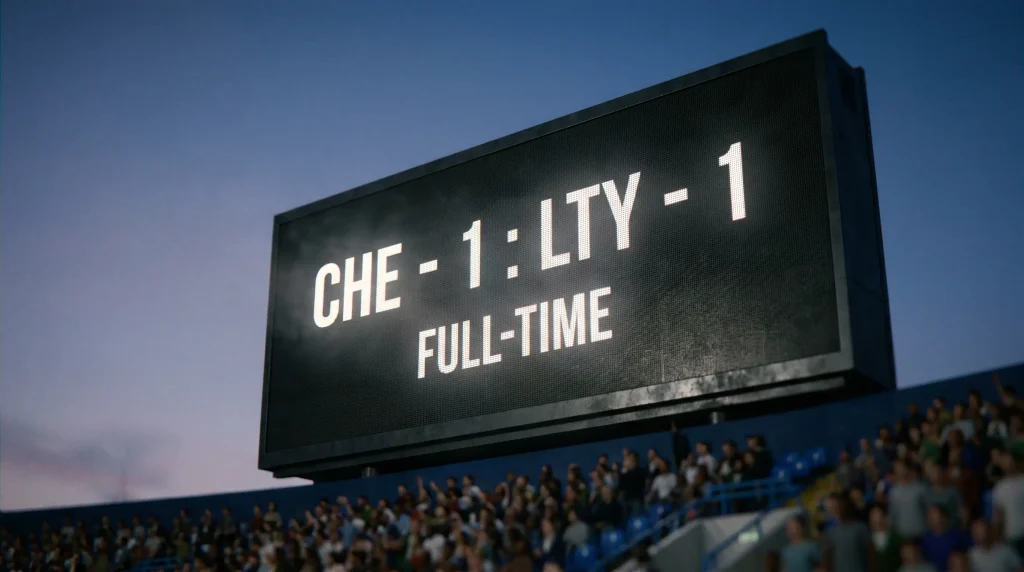
I have a soft spot for the draw. Not because it is exciting — nothing about a 0-0 or a 1-1 sets the pulse racing — but because it is the most systematically mispriced outcome in football betting. The draw is the market’s afterthought, and afterthoughts are where value lives.
Football generates £1.1 billion in gross gaming yield in the UK annually, with 5.8% of the population placing football bets. The overwhelming majority of those bets back a team to win. Home or away, favourite or underdog — punters want a winner. The draw sits in the middle of the 1X2 market collecting dust. Bookmakers know this, which means the draw price is often the least accurately calibrated of the three match-result outcomes. It absorbs less money, attracts less scrutiny, and carries pricing slack that a sharp punter can exploit.
Across the top five European leagues, draws account for roughly 24-28% of all match outcomes depending on the season. Yet the average implied probability assigned to draws in those markets is often lower than that actual frequency. The gap is not large — 1 to 3 percentage points — but at odds of 3.20 to 3.60, a small probability edge translates into a meaningful expected value per bet.
Statistical Indicators That Point to a Draw
Not every match is a draw candidate. The skill is identifying the fixtures where the probability of a stalemate is higher than the market suggests, and the indicators are measurable.
The strongest predictor I use is the xG differential between the two teams over their last eight to ten matches. When both teams produce similar xG output — within 0.3 of each other — and both concede similar xGA, the match is fundamentally even, and even matches produce draws more frequently than the market prices suggest. The UK remote sector generated £7.8 billion in gross gaming yield across betting and casino in the year to March 2025, and the data infrastructure behind those markets provides the xG figures needed for this analysis. The data is there — most punters just do not use it for draw identification.

The second indicator is low combined xG. When both teams are defensively solid — each conceding under 1.0 xGA per match — the match is likely to be low-scoring, and low-scoring matches produce draws more often than high-scoring ones. A 0-0 or 1-1 is far more likely in a fixture with a combined xG expectation of 1.8 than in one with an expectation of 3.5. I filter for matches where the combined expected goals sit below 2.2 and both teams have similar attacking and defensive profiles.
Third, I look at league position proximity. Matches between teams within five places of each other in the table — particularly in mid-table — produce draws at a higher rate than matches with large positional gaps. This is intuitive: closely matched teams produce closely matched results. But the market often prices mid-table fixtures as if one team is a clear favourite based on minor form differences that do not survive statistical scrutiny.
Draw Rates by League and Fixture Type
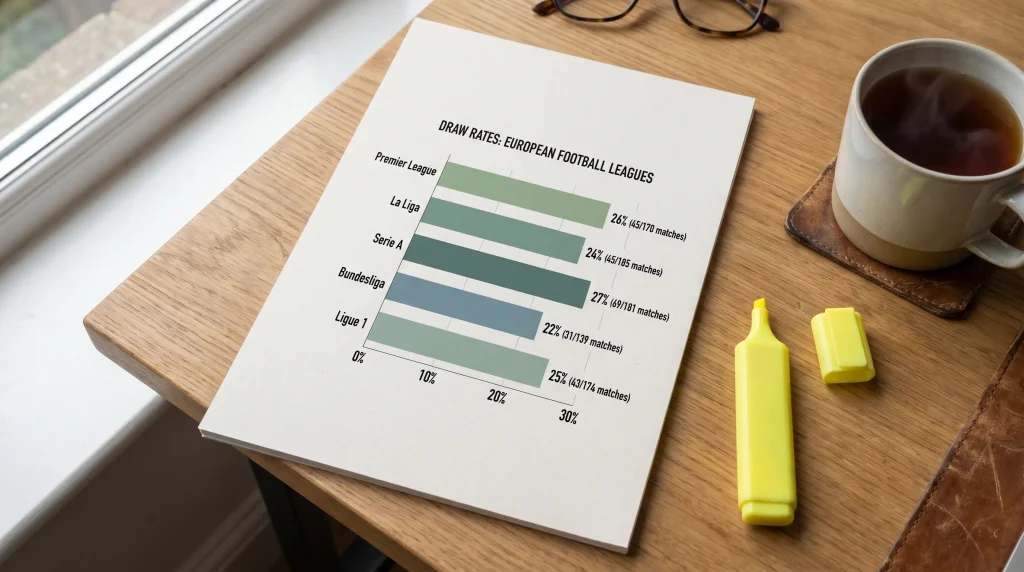
The draw rate is not uniform across leagues, and knowing the baseline for each competition you bet on matters enormously. Nearly one in ten UK adults places a sports bet monthly, and most of them bet across multiple leagues without adjusting their expectations for league-specific draw frequencies. That is a mistake.
Serie A and Ligue 1 historically produce the highest draw rates among Europe’s top five leagues, often exceeding 27% in a given season. La Liga sits around 24-26%. The Premier League and Bundesliga tend to produce the fewest draws, typically 22-25%. These are averages — individual seasons vary — but the baseline matters for pricing. A draw at 3.30 in Serie A implies roughly 30% probability. If the league’s historical baseline is 27% and the specific fixture has additional draw-favourable indicators, the gap between implied and likely probability may be slim. The same price in the Bundesliga, where the baseline is lower, might represent better value if the fixture-specific indicators are strong.
Fixture type also matters. Early-season matches — the first six rounds — produce fewer draws because teams are still finding their rhythm and results are more volatile. Mid-season matches, particularly in December and January when fixture congestion compresses preparation time, produce more draws. End-of-season matches split sharply: fixtures with something at stake (promotion, relegation) tend toward caution and draws, while dead rubbers produce unpredictable results that do not follow draw-rate patterns reliably.
Draw No Bet vs Backing the Draw — Different Strategies
A common question from punters who recognise the draw’s value but dislike the hit rate: why not just use draw no bet instead? It is a reasonable question with a nuanced answer.
Draw no bet — where your stake is refunded if the match ends in a draw — is a different product entirely. You are backing a team to win with insurance against the draw. The price is shorter than a straight win because you are paying for that insurance. It has nothing to do with the value of the draw itself. You are not profiting from the draw — you are avoiding the loss from it.
Backing the draw outright is a positive bet on a specific outcome at long odds. The risk is higher — you lose if either team wins — but the reward is proportionally larger. Over a season of 50 draw selections at average odds of 3.40, even a modest edge of 2-3 percentage points above implied probability generates a meaningful return. The variance is real — losing runs of 8 to 12 are normal — but the compounding effect of repeatedly backing an underpriced outcome at 3.40 is powerful.
My approach is to use both, but for different purposes. I back the draw outright when my model shows clear value on the draw outcome specifically — when the xG profiles, league draw rate, and fixture context all align. I use draw no bet when I want to back a team I believe will win but the draw probability is high enough that I want protection. They are complementary tools, not substitutes. For punters interested in exploring another underpriced match-result outcome, the correct score guide covers how to model specific draw scorelines like 0-0 and 1-1 using Poisson distributions.

What is the average draw rate across Europe"s top five leagues?
The average draw rate across the Premier League, La Liga, Bundesliga, Serie A and Ligue 1 is approximately 24-27% depending on the season. Serie A and Ligue 1 typically sit at the higher end while the Premier League and Bundesliga sit at the lower end. These baselines shift slightly from year to year but remain remarkably stable over five-season windows.
Is draw no bet a safer alternative to backing the draw outright?
Draw no bet and backing the draw are fundamentally different strategies. Draw no bet insures a team selection against a stalemate at the cost of shorter odds. Backing the draw outright is a direct bet on the draw at longer odds with higher variance. Neither is inherently safer — they serve different purposes. Use draw no bet for team-backed positions with draw risk, and back the draw outright when the draw itself is the value selection.
Articles
Created by the "Football Bet Today" editorial team.
