
Championship Betting Tips — Exploiting the EFL's Unpredictable Second Tier
 Available in US
The Championship — Where Variance Is a Punter’s Weapon
I remember watching a Championship side sitting 18th at Christmas go on a 14-match unbeaten run and finish in the play-off places. That kind of swing does not happen in the Premier League. It barely happens in League One. The Championship occupies a unique position in English football — enough quality to produce genuinely good matches, enough chaos to produce genuinely mispriced odds.
The remote betting and casino sector generated £7.8 billion in gross gaming yield in the financial year to March 2025, with football accounting for the single largest share. But while the Premier League attracts the sharpest pricing models and the deepest liquidity, the Championship sits one tier below in both respects. Bookmakers still price it carefully, but their models lean more heavily on surface-level form data and less on the granular metrics that drive Premier League pricing. That gap between model sophistication and on-pitch reality is where edges live.
Twenty-four teams, 46 matches each, a promotion race that runs until May, a relegation battle that often goes to the final day — the Championship is a marathon that rewards patience and punishes punters who overreact to short-term results. The variance is structural, not accidental. Squads are thinner, budgets are more uneven, and managerial changes happen more frequently than in any other division in Europe. All of that creates pricing inefficiency.
Promotion Race and Playoff Betting Angles
Have you ever looked at the automatic promotion market in September and compared it to the same market in March? The prices shift dramatically, and the mid-season pivot is where I have found some of my best long-term bets over the years.
The Championship’s promotion structure — two automatic spots plus four play-off places — creates distinct betting phases. Early season, the outright markets are wide open and bookmakers price largely on pre-season expectations: summer spending, managerial appointments, squad strength on paper. By October, form data starts to override those priors. By January, the transfer window reshuffles the deck again. Each transition creates a window where the market has not fully adjusted to new information.

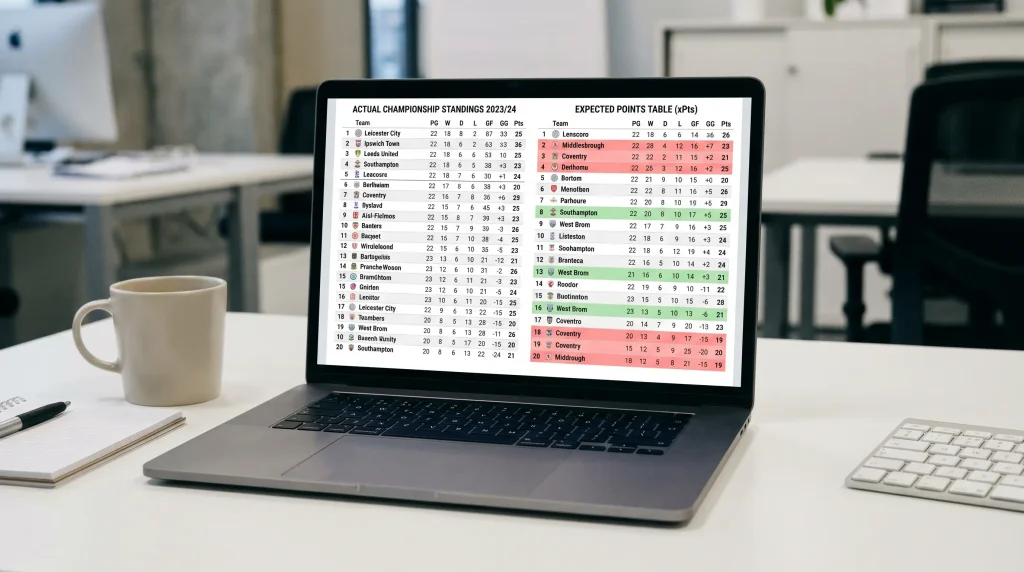
I focus on two specific angles in the promotion race. First, teams whose early-season form lags behind their underlying performance metrics. A side sitting 10th in the table but 4th in expected points — derived from xG for and against — is being underpriced by the outright market. The results have not caught up to the process yet, but across a 46-game season, they almost always do. Second, January signings that materially upgrade a squad’s weakest position. A promotion-chasing team that adds a proven Championship goalkeeper or centre-back mid-season can see its defensive numbers shift within weeks, but the outright market adjusts slowly.
The play-offs are a separate beast. Four teams, three matches each, and the variance is enormous. I treat play-off betting as high-volatility entertainment rather than a value-seeking exercise — the sample sizes are too small and the emotional intensity too high for any model to price reliably. If you want to bet on the play-offs, keep the stakes recreational.
xG-vs-Points Gaps — Finding Overperformers and Underperformers
The single most predictive signal I have found in Championship betting is the gap between a team’s actual points tally and their expected points based on xG. Football is the most popular betting sport in the UK — 5.8% of the population places football bets — and most of those punters look at the league table. The league table tells you what has happened. The xG table tells you what should have happened, and the difference between the two is your edge.
An overperforming team — one with significantly more actual points than expected points — is typically riding a combination of clinical finishing, goalkeeper heroics, and favourable variance. Those factors regress over a 46-game season. Backing against overperformers in the second half of the season, particularly when they face fixture congestion, has been one of my most reliable Championship strategies.
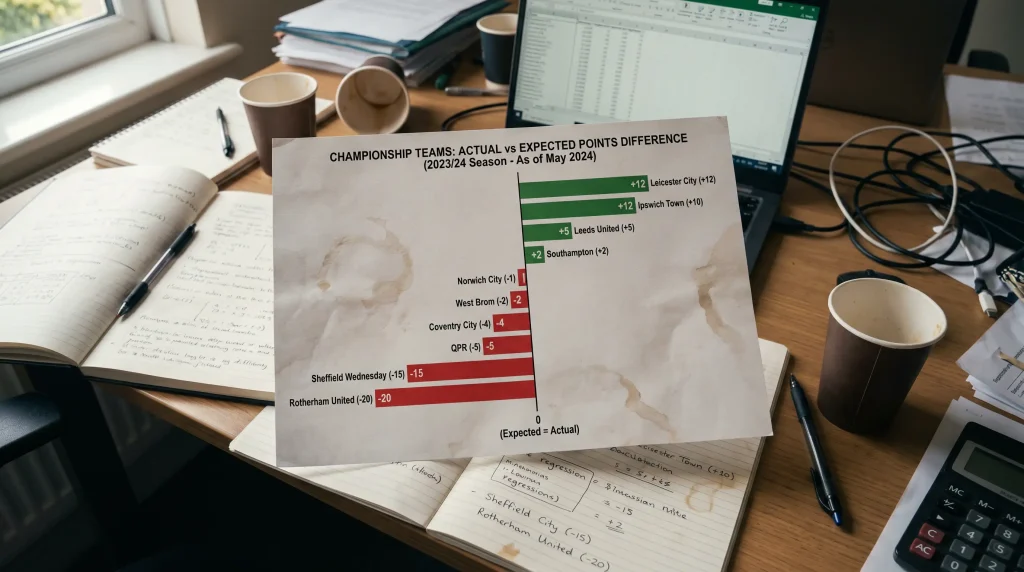
Conversely, underperformers — teams with fewer actual points than expected — are usually creating good chances but failing to convert or conceding soft goals. The underlying process is sound. Over the remaining fixtures, their results tend to improve. Backing underperformers in match result and totals markets from December onwards has produced a positive return in seven of my last nine tracked Championship seasons.
Where do you find this data? Several free platforms publish Championship xG tables with weekly updates. I cross-reference at least two sources to smooth out model differences. The key metric is cumulative xG difference — the gap between xG for and xG against — compared against the actual goal difference. A team with a +12 xG difference but only a +3 actual goal difference is primed for positive regression.
Squad Depth and Fatigue in a 46-Game Season
The Championship is the longest season in professional English football. Forty-six league matches, plus cup competitions, plus potential play-offs. Premier League squads have 25-man registered lists padded with international-quality depth. Championship squads often rely on 15-16 regular starters with limited rotation options.
Fatigue is not abstract in this division — it is measurable. I track minutes played by key players across the season and flag matches where a team’s first-choice midfield or defensive unit has accumulated over 3,000 minutes each. Beyond that threshold, injury risk spikes and performance metrics — particularly pressing intensity and sprint distances — decline. Teams approaching that marker, especially in February and March when the fixture list compresses around FA Cup weekends, become vulnerable in ways the match odds do not always reflect.

Newly relegated sides present a specific squad-depth angle. They arrive in the Championship with larger, more expensive squads but also with players who may not be motivated by second-tier football. The first half of the season often goes well as superior quality tells. The second half is where the cracks appear — wage-bill disputes, January departures, and a squad that mentally checked out after Christmas. I have learned to fade relegated sides in the spring unless their xG data remains strong.
If the Championship’s unpredictability appeals to you but you want to go deeper into English football’s lower tiers, the League One and League Two guide covers how similar principles apply with even thinner data and wider pricing gaps.
Why are Championship matches harder for bookmakers to price accurately?
Bookmaker pricing models are strongest where data is deepest. The Championship has less granular publicly available data than the Premier League, higher managerial turnover that disrupts tactical patterns, and greater squad instability through loan markets and January transfers. These factors introduce noise that automated models handle less well than in the top flight.
How does the 46-game season affect late-season form?
Squad depth becomes the decisive variable from February onwards. Teams relying on a small core of 15-16 players accumulate fatigue that shows up in declining pressing metrics and increased injury rates. The xG-vs-points gap often widens in the final quarter of the season as physically fresher sides with deeper squads outperform tired rivals whose early-season form masked thin resources.
Articles
Published by the Football Bet Today team.
