
BTTS and Win Tips Today — Combined Market Picks With Value Flags
 Available in US
BTTS and Win — a Tougher Market, but Bigger Prices
The first time a punter asked me about BTTS and win as a combined market, I told them to avoid it. The hit rate is low, the variance is brutal, and most people who bet it are chasing big prices without understanding the probability structure underneath. I still believe most recreational punters should stay away from it as a regular market. But for those willing to do the analytical work, BTTS and win is one of the few football markets where genuine overlays appear regularly — because the bookmaker’s pricing of the combined outcome is less precise than their pricing of each component separately.
Football generates £1.1 billion in gross gaming yield annually in the UK, and BTTS and win is a small but growing segment of that market. The appeal is the price — a home win combined with both teams scoring might trade at 3.00 to 4.50 depending on the fixture, compared to 1.60 to 2.20 for a standalone home win. That price premium reflects the additional condition, but the premium is not always proportional to the additional risk. When the bookmaker overcharges for the BTTS condition on a match where both teams scoring is likely, the combined price contains value that neither the standalone match result nor the standalone BTTS market offers.
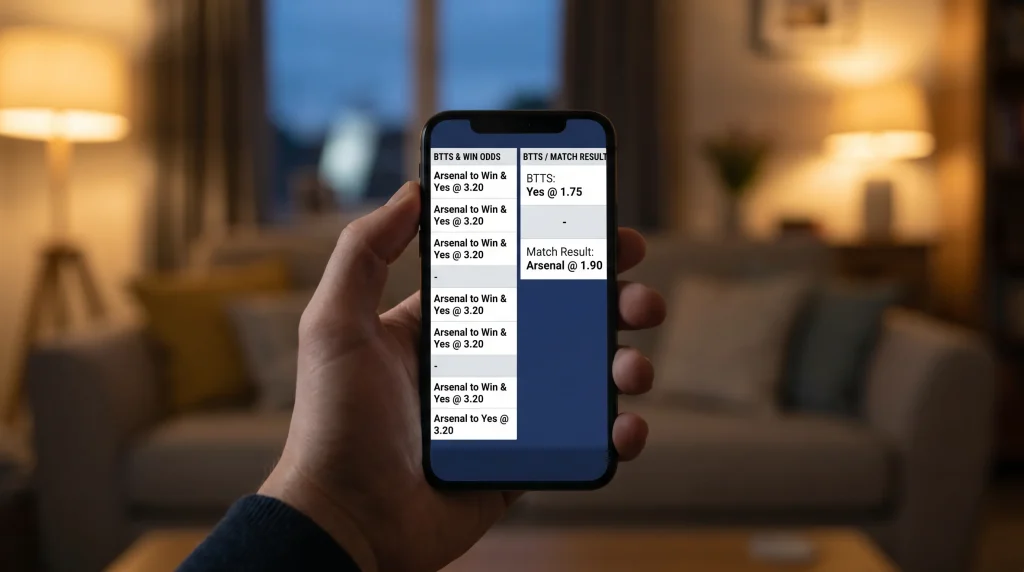
Calculating Combined Probability for BTTS + Result
The maths behind BTTS and win is straightforward but requires two independent probability estimates. First, what is the probability of the match result you are backing — home win, draw, or away win? Second, given that match result, what is the probability of both teams scoring?
These two probabilities are not independent. A home win where both teams score means the home team scored at least two goals (to outscore the opponent who also scored at least one). That is a narrower outcome than a home win where both teams score zero or one — say a 1-0. So the combined probability is not simply P(Home Win) x P(BTTS Yes). It is P(Home Win AND BTTS Yes), which requires considering the conditional relationship.
I estimate this using my Poisson model. I generate a full scoreline probability grid — the probability of every scoreline from 0-0 to 5-5 — then sum the probabilities of all scorelines that satisfy both conditions. For “Home Win and BTTS Yes,” that means summing the probabilities of 2-1, 3-1, 3-2, 4-1, 4-2, 4-3, and so on. The sum gives me a direct combined probability that I compare against the bookmaker’s implied price. With roughly 290 million online sports bets placed monthly in the UK, the bookmakers’ BTTS-and-win pricing is automated and model-driven — but their model and mine often disagree, and my model has performed well enough over four years to suggest the disagreement is not random.
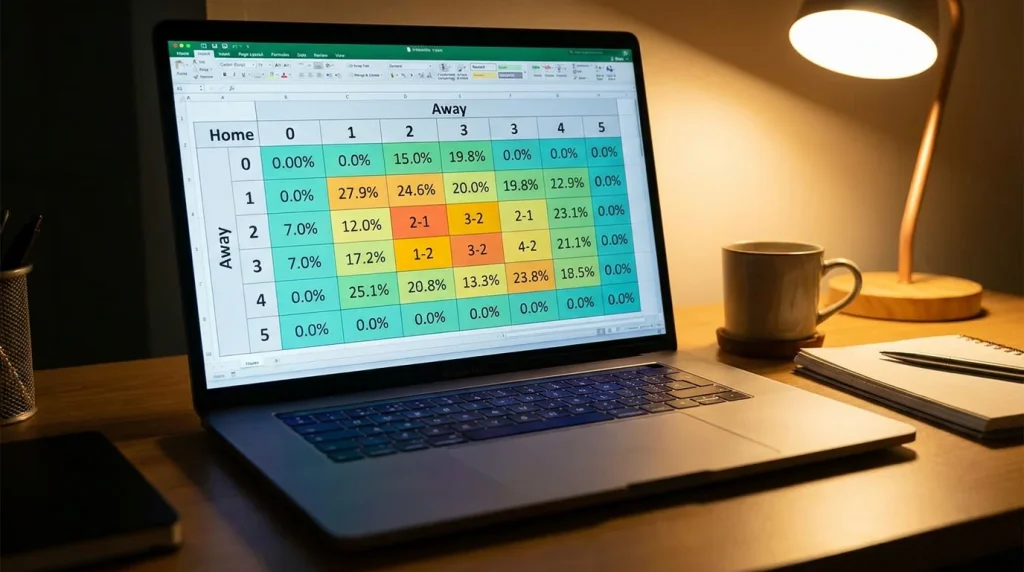
A worked example: my Poisson grid gives a fixture the following relevant scoreline probabilities — 2-1 home at 12.5%, 3-1 at 6.2%, 3-2 at 4.1%, 4-1 at 1.8%, 4-2 at 1.2%. Summing those gives a combined “Home Win and BTTS Yes” probability of 25.8%. If the bookmaker prices that outcome at 3.50 — implying 28.6% — there is no value. But if the bookmaker prices it at 4.50 — implying 22.2% — my model shows a 3.6 percentage point edge. At those odds, that edge is worth pursuing.

Team Profiles That Suit the BTTS-Win Market
Not every team is a good BTTS-and-win candidate. The profile I look for is specific: a strong attacking team with a leaky defence. That sounds like a criticism, but in this market it is the ideal combination.
A team that scores frequently but concedes regularly — say averaging 1.8 xG for and 1.3 xGA per match — will produce BTTS results in a high proportion of their wins. Their victories tend to be 2-1, 3-2, 3-1 rather than 1-0 or 2-0. The BTTS-and-win market rewards this profile because the two conditions — scoring enough to win and conceding at least one — align naturally. A team that wins 2-0 frequently contributes to your win leg but kills the BTTS leg. You want teams that win with the door ajar.

I maintain a seasonal list of “BTTS-win-friendly” sides across the leagues I bet on. The criteria are simple: above-average xG for (top 40% of the league), above-average xGA conceded (bottom 40% defensively), and a win rate that sits within the top half of the league. Teams meeting all three criteria typically produce BTTS-and-win outcomes in 35-45% of their matches, which is significantly above the baseline of 25-30% for the average side. When those teams face opponents who also score regularly — creating a match where BTTS Yes is highly likely regardless of the result — the combined price often underestimates the true probability.
Where Bookmakers Overprice the Combined Outcome
The pricing of combined markets like BTTS and win involves multiplying component probabilities — match result and BTTS — and applying a margin to the product. The bookmaker’s margin on the combined outcome is typically larger than the margin on either component alone, because the additional complexity gives them room to build in extra overround without punters noticing.
Where this breaks down is in matches with specific characteristics that the component models handle well individually but combine poorly. If the bookmaker’s match-result model says “home win 55%” and their BTTS model says “BTTS Yes 60%,” the naive combined probability is 33%. But if those two outcomes are positively correlated in this specific fixture — because the home team’s winning pattern inherently involves conceding — the true combined probability is higher than 33%. The bookmaker’s model may not fully capture the fixture-specific correlation, particularly for lower-profile matches where less manual oversight is applied to the pricing.
I find the strongest overlays in three scenarios. First, fixtures between two attacking sides where the match-result favourite has a leaky defence — the correlation between winning and conceding is highest here. Second, derby matches where the intensity drives both teams to attack — the BTTS rate in derbies is typically 5-8 percentage points above the league average. Third, early-season matches when teams are still finding defensive shape and the goals-per-game rate is elevated across the league. If you want to understand the BTTS component in isolation before tackling the combined market, the BTTS guide covers the statistical indicators and league-by-league rates in full.

How is BTTS and win priced differently from a standalone BTTS bet?
BTTS and win combines two conditions — a specific match result plus both teams scoring — into a single outcome. The price reflects the lower probability of both conditions landing simultaneously. Bookmakers apply a larger margin to the combined product than to either component alone, which creates both a pricing obstacle and an opportunity. When the correlation between the two conditions is higher than the bookmaker"s model assumes, the combined price underestimates the true probability and value exists.
Which team profiles historically produce the most BTTS-and-win results?
Teams with above-average attacking output and below-average defensive records — those that win frequently but concede regularly — produce BTTS-and-win outcomes most often. Typical scorelines for these sides are 2-1, 3-2 and 3-1 rather than 1-0 or 2-0. A team averaging 1.8+ xG and 1.2+ xGA per match, with an above-average win rate, is the ideal BTTS-and-win profile.
Articles
Written by the editors at Football Bet Today.
