
Both Teams to Score Tips Today — BTTS Picks Backed by Data
 Available in US
BTTS in Numbers — Why Both Teams Scoring Is Rarely a Coin Flip
I remember the exact moment I stopped treating BTTS as a 50/50 market. It was a December fixture, two mid-table Championship sides, both leaking goals — an obvious BTTS Yes on paper. I backed it, the match finished 0-0, and when I dug into the data afterwards I realised both sides had been conceding goals primarily from set pieces, not open play. Their opponents that day were among the weakest set-piece creators in the division. The “obvious” BTTS was never as likely as the raw goals-conceded numbers suggested.

That loss forced me to rethink how I assess the BTTS market, and the lesson has been worth thousands of pounds since. Football is the most popular sport for betting in the UK, generating roughly 1.3 billion pounds in gross gaming revenue from remote betting alone. A meaningful portion of that flows through BTTS markets because the concept is seductively simple: will both sides find the net? Yes or no. But simplicity in the question masks serious complexity in the answer.
The league-wide BTTS Yes rate across England’s top four divisions hovers between 48% and 58% depending on the season and the tier. That is close to a coin flip in aggregate, which is precisely why bookmakers can price it attractively — the public sees near-50% outcomes and assumes they have a genuine read on which matches will land on which side. The reality is that individual fixture BTTS probabilities vary enormously, from under 30% to above 70%, depending on the specific defensive and attacking profiles involved. Finding the fixtures where the true probability diverges meaningfully from the bookmaker’s price is the entire game.
Over the next six sections, I will walk through the metrics that actually predict BTTS outcomes, the league-level patterns that create structural edges, and the pricing mechanisms that occasionally leave bookmakers exposed. This is not a list of today’s picks — it is the framework that generates those picks.
The Stats That Predict BTTS Outcomes
When I first started tracking BTTS data seriously, I made the beginner’s mistake of looking at goals scored and goals conceded in isolation. Team A scores 1.8 per match, Team B concedes 1.5 per match — BTTS Yes, surely? The problem with that logic is that it ignores the mechanism behind the goals. Where the goals come from, how they are conceded, and the quality of chances created matter far more than the raw tallies.
The metric I lean on most heavily is expected goals against — xGA. A team’s xGA measures the quality of chances they concede, regardless of whether those chances were actually converted. A side conceding 1.0 xGA per match but only 0.6 actual goals is riding luck that will eventually correct. For BTTS purposes, I want both teams in a fixture to have high xGA — ideally above 1.2 per match over their last eight games. That tells me both defences are creating quality scoring opportunities for opponents, even if the scoreboard has not fully reflected it yet.
On the attacking side, I look at non-penalty expected goals — npxG. Penalties distort scoring records because they are high-conversion events that say nothing about a team’s open-play attacking quality. A side averaging 1.5 goals per match but 0.4 of those from penalties is a weaker BTTS candidate than a side averaging 1.3 with nearly all from open play. The penalty-taker gets you one goal; a flowing attacking unit gets you goals across different match states.
Shot volume inside the box is the third pillar. Teams that generate 10+ shots per match but primarily from outside the area are creating low-quality chances that are unlikely to produce goals against organised defences. I filter for shots inside the 18-yard box specifically — a team averaging six or more per match is consistently getting into dangerous positions, which directly feeds the BTTS probability.
The UK’s remote casino, betting and bingo sector generated 7.8 billion pounds in GGY in the year to March 2025, and bookmakers invest heavily in their own models using similar data. But their models price markets for the full fixture list, while I am picking individual matches where the data alignment is strongest. That selectivity is the edge.
Finally, I cross-reference with clean-sheet rates. A team keeping clean sheets in fewer than 20% of their matches is a prime BTTS candidate regardless of other metrics — the defence simply does not shut opponents out. Conversely, a side with a 45%+ clean-sheet rate is a strong BTTS No lean, even if the opponent scores freely against everyone else. Clean-sheet rate captures something intangible — defensive organisation, game management, an ability to close matches out — that xGA alone can miss.
BTTS Rates by League — Where Goals Flow Freely
Not all leagues are created equal when it comes to BTTS, and failing to account for league-level tendencies is one of the most common errors I see in BTTS betting. I spent a full off-season mapping BTTS Yes percentages across the 15 leagues I bet on regularly, and the variation is striking.
The Bundesliga consistently posts the highest BTTS Yes rate among Europe’s top five leagues — typically between 55% and 60% in any given season. The reasons are structural: German football favours aggressive pressing, high defensive lines, and transitional attacking play, all of which create open, end-to-end matches. The 25-34 age group shows the highest gambling participation rate in the UK at 35%, and this demographic tends to follow European leagues closely, which means Bundesliga BTTS markets carry decent liquidity even from UK bookmakers.
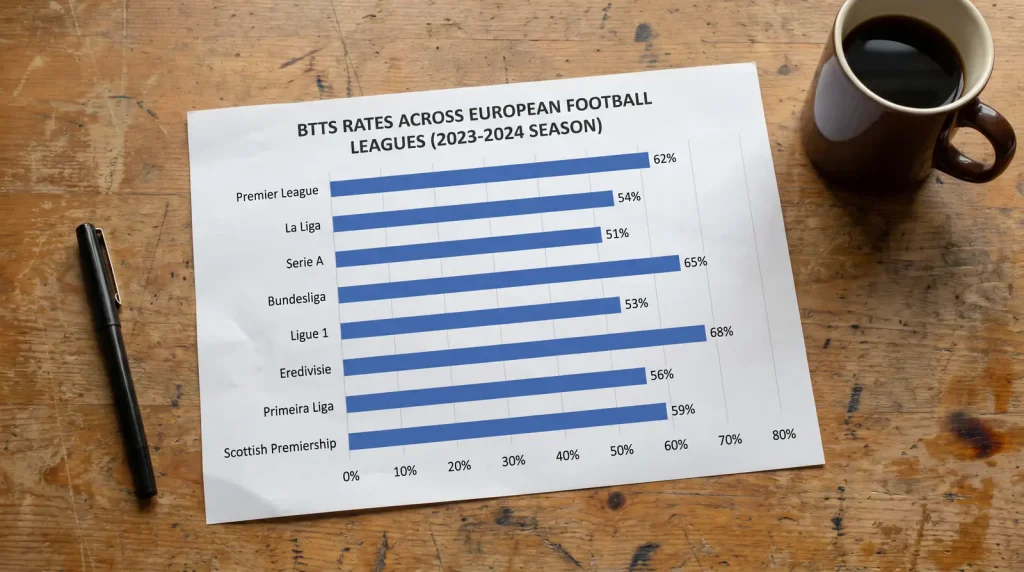
The Premier League sits in the middle of the range — around 52-55% BTTS Yes — but with significant variance depending on the fixture. Matches involving sides managed by possession-dominant coaches tend to suppress BTTS rates because they control territory and limit opponent touches in the final third. Matches between two transition-oriented sides — especially in the bottom half of the table — produce BTTS rates well above the league average. I weight my Premier League BTTS analysis heavily towards tactical style, not just form.
League One and League Two are where BTTS punters often find the most exploitable mispricing. These leagues have BTTS Yes rates around 52-56%, but bookmaker pricing is less refined because the data models for lower-league English football are thinner. I have found consistent edges in League Two BTTS markets specifically, where the combination of lower defensive quality and less accurate bookmaker modelling creates pricing gaps that persist across entire half-seasons.
La Liga sits at the other end of the spectrum — BTTS Yes rates in Spain are typically the lowest among the top five European leagues, hovering around 46-50%. Spanish football’s tactical emphasis on defensive structure, low block setups, and controlled possession means many matches produce goals at only one end. If you are building a BTTS acca, loading it with La Liga fixtures is a structural disadvantage that no amount of form analysis can overcome.
I always check the league’s seasonal BTTS trend before committing to any selection. Some leagues start slowly — cautious early-season football — and open up as the campaign progresses and desperation sets in. Others compress their goals into the first two months and tighten defensively once the table takes shape. Knowing where your target league sits in its seasonal cycle adds a layer of context that most punters ignore.
One pattern I have tracked across multiple seasons is the “December spike” in BTTS rates across English football. Fixture congestion during the festive period — three matches in eight days for most sides — degrades defensive organisation. Tired legs lead to slower tracking runs, deeper second-half defensive lines, and more goals conceded from transition. December BTTS Yes rates in the Championship have historically run 5-8% above the season average, and I weight my BTTS betting heavily towards this window every year.
When to Back BTTS No — Clean-Sheet Indicators
Most of the attention in BTTS markets goes to the Yes side, and for good reason — it is the more exciting bet and the one that aligns with the majority’s expectation of goals. But BTTS No is where I have found some of my most consistent returns over the last five years, precisely because the public underweights it.
The starting point for a BTTS No assessment is identifying at least one side in the fixture with a genuine clean-sheet pedigree. I look for teams keeping clean sheets in 35% or more of their matches across the last 10 games. That is roughly one clean sheet every three matches, which sounds modest but actually represents above-average defensive reliability. I then cross-reference with the opponent’s scoring consistency — specifically, how often they fail to score in matches. A team blanking in 30%+ of their fixtures is a prime candidate for the “No” side of this market.

Context matters enormously for BTTS No. Some match states suppress goals structurally. Early-round cup ties between sides from different divisions often produce cautious football, especially from the lower-league team. Matches with significant tactical asymmetry — a deep-block defensive side hosting a possession team that struggles to break down compact defences — are textbook BTTS No scenarios. I have also found that Friday night fixtures and Monday night games produce slightly lower BTTS Yes rates than Saturday 3pm kick-offs, though the sample sizes are smaller and the effect is marginal.
The pricing on BTTS No is often generous. Bookmakers know that the public gravitates towards Yes, so they shade the No price slightly to balance their book. Over a full season, I have tracked BTTS No implied probabilities versus actual outcomes and found a persistent gap of 2-4% in favour of the No bettor. That does not sound like much, but compounded across 50+ selections per season it generates meaningful returns.
One warning: BTTS No is a higher-variance bet than Yes in certain league contexts. A single late goal from a team that has barely threatened all match can flip a comfortable No into a loss. I manage this by keeping BTTS No stakes consistent and never chasing a specific match because I “feel” a clean sheet is coming. The data either supports it or it does not.
I also pay close attention to the referee appointment. Some referees are permissive with physical challenges and let defenders break up attacks that would result in fouls under stricter officials. A lenient referee assignment combined with a defensively solid team is a double reinforcement for BTTS No. I keep a simple log of referee tendencies — fouls awarded per match, penalty frequency — and factor it into any BTTS No selection where the margin between Yes and No is tight.
Building BTTS Accumulators — Reducing Correlation Traps
BTTS accumulators are wildly popular — and wildly misunderstood. I see four and five-fold BTTS accas posted online every day, often combining fixtures from the same league and kick-off time as though they are independent events. They are not, and the correlation problem I described in general acca terms applies with particular force to BTTS markets.

The primary correlation trap in BTTS accas is weather. If you back BTTS Yes in four Premier League 3pm kick-offs and three of them are being played in heavy rain across the Midlands and North, you have effectively made one weather bet disguised as four. Wet pitches suppress open-play goal quality, increase defensive errors from set pieces, and generally reduce the probability of both teams scoring from open play. I always check the weather forecast for every fixture in a BTTS acca and ensure I have geographic diversity.
The second trap is league-level correlation. Backing BTTS Yes across five Championship fixtures assumes those five matches are independent, but Championship football has week-to-week rhythms. If three or four sides in the division have simultaneously shifted to more defensive setups — common during promotion run-ins when results matter more than performance — the entire league’s BTTS rate drops for a spell. I limit my BTTS accas to a maximum of two selections from the same division and try to spread across at least three different leagues or tiers.
Over 70% of UK online sports bets are placed in-play, and BTTS accas are often built pre-match and then left to run. That is fine if your process is solid, but I increasingly use a staggered approach: I place a double on the early kick-offs, wait for those results, and then decide whether to add an evening or Sunday selection as a separate bet rather than committing to a pre-built four-fold. This gives me the flexibility to adjust based on emerging information — an injury in the warm-up, a tactical surprise in the line-ups — without being locked into a static acca. The over 2.5 goals analysis often overlaps with BTTS assessments, so I cross-reference between the two markets before committing to any combination.
How Bookmakers Price BTTS — and Where They Slip
I spent a month last winter reverse-engineering BTTS pricing from three major UK bookmakers, and the patterns were revealing. Bookmakers price BTTS by modelling each team’s scoring probability and clean-sheet probability independently, then combining them. The BTTS Yes price is derived from: (1 – Probability Team A keeps a clean sheet) multiplied by (1 – Probability Team B keeps a clean sheet). The bookmaker then applies a margin — typically 5-8% on BTTS markets — and publishes the price.

The weakness in this model is that it treats the two scoring events as independent. In reality, match state creates dependence. If Team A scores first, Team B’s approach changes — more attacking, more open — which increases both the probability of Team B scoring and the probability of Team A scoring again. The pre-match BTTS model does not capture this dynamic feedback loop, and in matches where one side is likely to score early (strong home favourites, for instance), the BTTS Yes probability is systematically underpriced.
Nearly one in ten UK adults places a sports bet at least once a month, and among those who bet on sports, 87% of men said they placed a bet in 2025 — a participation rate that gives bookmakers enormous volume. That volume means they can afford thin margins per bet, but it also means their models are optimised for the aggregate, not for the specific fixture where conditions deviate from the norm. Edge in BTTS betting lives in the deviations.
Where I find the most consistent mispricing is in matches involving newly promoted sides. Bookmakers tend to undershoot promoted teams’ scoring ability in the first third of the season — their models weigh the previous (lower-league) defensive data too heavily and undervalue the attacking talent that earned promotion. Promoted sides in the Championship and League One frequently produce BTTS Yes at rates 8-12% higher than the bookmaker’s implied probability in their first 15 fixtures. By Christmas, the models catch up and the edge disappears — but those opening months are fertile ground.
One final pricing note: BTTS odds tend to tighten (become less generous) closer to kick-off as sharp money enters the market. If you have done your analysis and identified a strong BTTS Yes selection, placing the bet 24-48 hours before kick-off often captures a better price than waiting for matchday. I break my own “wait for team news” rule here because BTTS is less sensitive to individual line-up changes than match-result or goalscorer markets — both teams scoring is a match-level event, and one player’s absence rarely shifts the probability by more than a couple of percent.
Frequently Asked Questions
What defensive stats best predict a BTTS No result?
Clean-sheet percentage over the last 10 matches is the strongest single indicator. A team keeping clean sheets in 35% or more of recent fixtures has the defensive consistency needed for BTTS No. I also check expected goals against (xGA) — a low xGA confirms the clean-sheet record is backed by genuine defensive quality rather than luck. Cross-reference both metrics before backing No.
Why do BTTS odds sometimes look too generous?
Bookmakers price BTTS by combining independent scoring probabilities for each team, which ignores how match state creates dependence between the two events. When one side scores first, the trailing team typically attacks more aggressively, increasing the chance of both sides scoring. This dynamic feedback loop is hard to model pre-match, and fixtures where an early goal is likely tend to have BTTS Yes probabilities that exceed the bookmaker"s implied number.
How do weather conditions affect both-teams-to-score outcomes?
Heavy rain and strong wind suppress open-play attacking quality and increase the likelihood of scrappy, low-scoring matches. Wet pitches reduce passing accuracy and make it harder for teams to build sustained attacks. I always check weather forecasts before placing BTTS selections — particularly for BTTS accas where multiple fixtures in the same region could all be affected by the same conditions, creating hidden correlation.
Which European leagues have the highest BTTS hit rates?
The Bundesliga consistently leads Europe"s top five leagues with BTTS Yes rates between 55% and 60%. The Premier League and Ligue 1 sit in the mid-50s. Serie A fluctuates but has trended upward in recent seasons. La Liga typically has the lowest BTTS rate among the top five, often below 50%, due to its emphasis on defensive structure and controlled possession.
Articles
Published by the Football Bet Today team.
