
Half-Time Full-Time Tips — Exploiting the Highest-Margin Football Market
 Available in US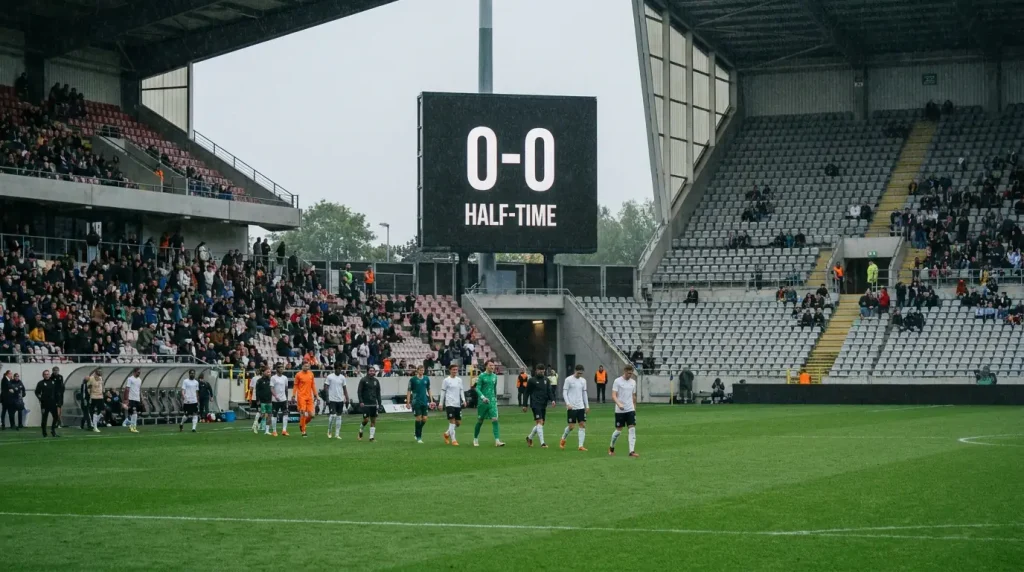
Nine Outcomes, One Market — Where Complexity Creates Opportunity
The half-time/full-time market terrified me when I first encountered it. Nine possible outcomes — home/home, home/draw, home/away, draw/home, draw/draw, draw/away, away/home, away/draw, away/away — at prices ranging from 2.50 to 40.00, with an overround that often exceeds 130%. It looked like a lottery. After two years of modelling it seriously, I realised it is the opposite: the complexity that scares most punters away is precisely what creates pricing inefficiencies that simpler markets do not offer.
Football generates GBP 2.6 billion in gross gaming yield from sports betting annually in the UK, and the half-time/full-time market captures a small but growing share. The overround is high because the bookmaker spreads margin across nine outcomes instead of three, and most punters lack the tools to check whether each individual price is fair. That combination — high margin and low scrutiny — is the recipe for exploitable mispricing. The bookmaker cannot price all nine outcomes accurately when the margin is loaded unevenly, and the unevenness is where value hides.
Modelling the Half-Time Scoreline From Your Poisson Grid
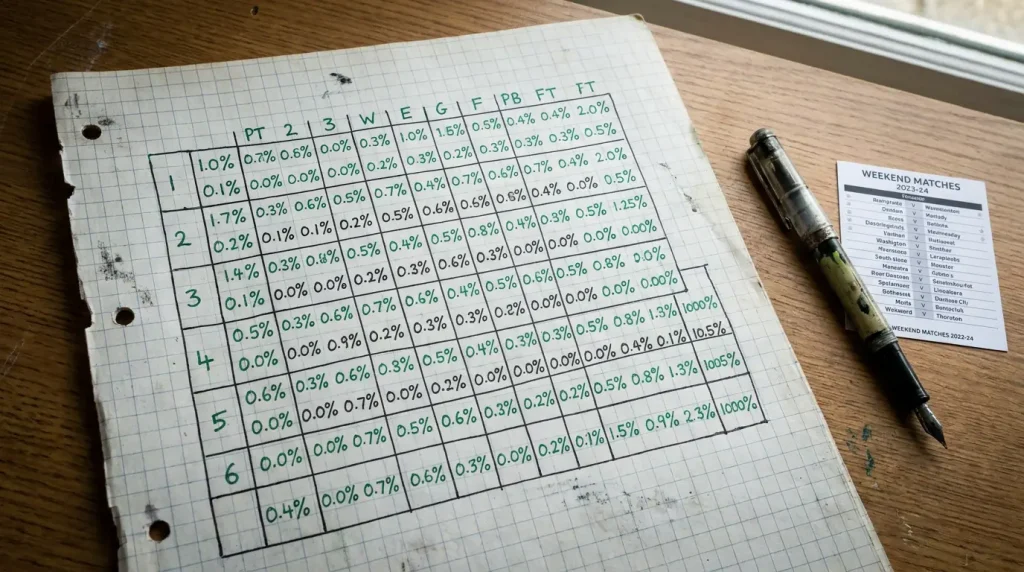
If you already use a Poisson model for correct score predictions, adapting it for half-time/full-time is straightforward. The trick is running two Poisson grids — one for goals in the first half and one for goals in the second half — rather than a single grid for the full match.
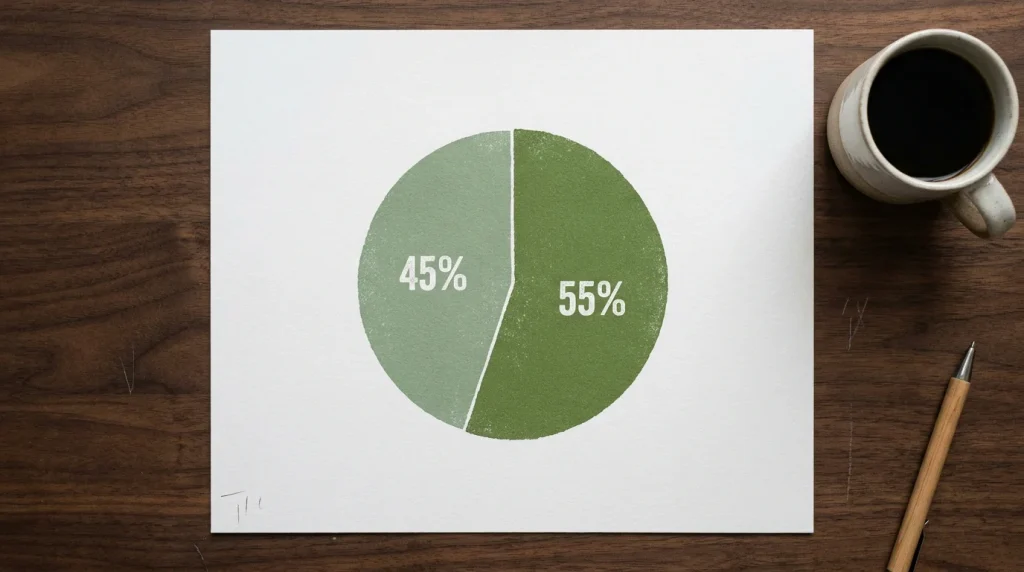
The inputs change slightly. First-half goal rates differ from second-half goal rates in predictable ways. Across the Premier League, approximately 44-46% of goals fall in the first half and 54-56% in the second half. I split each team’s expected goals into first-half and second-half estimates using this ratio, adjusted for team-specific patterns. Some teams start fast and fade — their first-half xG proportion exceeds 50%. Others are slow starters who improve after the break. These patterns are measurable over eight-to-ten-match rolling samples and they shift the half-time outcome probabilities meaningfully.
Once you have the first-half Poisson grid, you can calculate the probability of each half-time state: home leading, draw, away leading. Combine that with the full-match probabilities from your standard Poisson grid and you get the probability of each of the nine half-time/full-time outcomes. The heavy lifting is done. The comparison against bookmaker prices follows the same implied-probability method used in every other market.
Draw/Home and Draw/Away — the Turnaround Plays
Two outcomes in this market produce the most consistent value in my records: draw/home and draw/away. These represent matches where the half-time score is level but one team goes on to win in the second half.
The reason these outcomes are underpriced is psychological. Punters who bet on half-time/full-time overwhelmingly back the “continuation” outcomes — home/home, away/away — because they feel intuitive. If the home team is going to win, they must be leading at half-time, right? The data says otherwise. Across the Premier League, roughly 35-40% of home wins come from a half-time position of level or trailing. The market underweights turnaround scenarios because the public money flows toward the simpler narrative of dominance from start to finish.
I target draw/home when my model identifies a strong home team facing an opponent that defends well in the first half but fades after the break. The defensive profile matters — a team with low first-half xGA but rising second-half xGA is a classic candidate for conceding a second-half winner after holding firm in the first 45 minutes. The 24.4 million active betting accounts in the UK generate enormous volume on the simpler continuation outcomes, leaving the turnaround prices wider than they should be.
Draw/away follows the same logic in reverse — an away team that struggles to break down the home defence early but improves tactically after the break. This pattern is common among sides managed by coaches who use the first half to observe the opponent’s setup and make precise half-time adjustments. I track second-half xG improvement rates by team as a secondary filter for draw/away selections. A team that consistently generates 40% or more of its match xG in the final 30 minutes is a strong candidate for turnaround results when level at the break.

The staking approach for turnaround bets must reflect the lower hit rate. Draw/home and draw/away outcomes occur in roughly 10-15% of matches each, compared to 25-35% for home/home or away/away. The prices compensate — typically 5.00 to 8.00 — but the variance between winning and losing runs is significant. I cap my turnaround stakes at 1% of bankroll and treat them as a supplementary market rather than a core strategy.
When the Favourite Trails at Half-Time — the HT/FT Edge
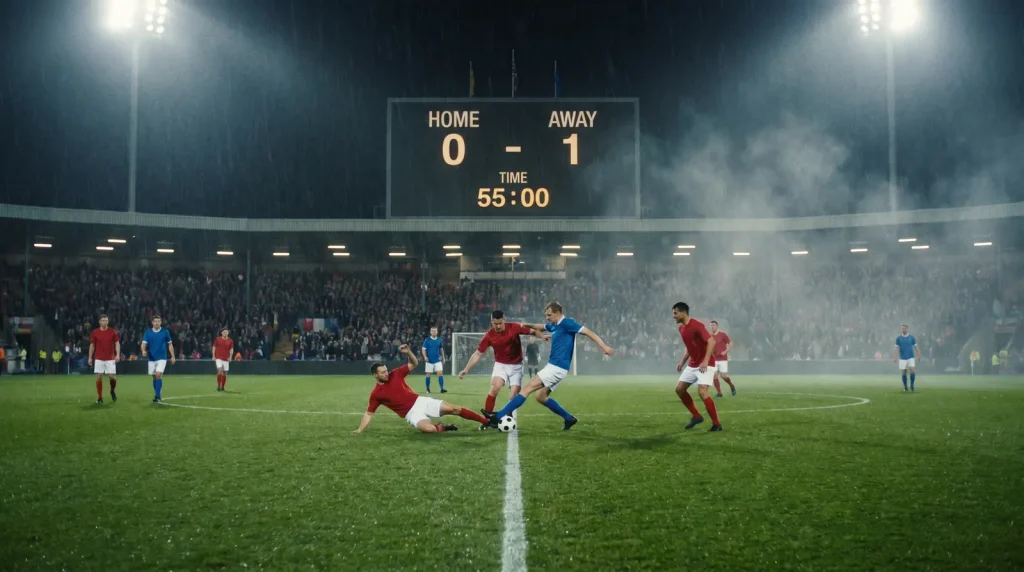
One of my best-performing seasonal strategies is a focused version of the above: backing favourites to trail at half-time and win at full-time. The away/home outcome specifically — where the away team leads at half-time but the home team wins at full-time — trades at enormous prices, typically 15/1 to 25/1. The implied probability at those odds is 4-6%. My model consistently estimates it at 6-9% for strong home teams facing opponents who score early but cannot sustain defensive intensity.
The edge is small in absolute percentage terms — 2-3 percentage points — but at odds of 15/1 to 25/1, even a tiny probability edge translates into substantial expected value per bet. The variance is extreme. You will lose this bet 90-94% of the time. But across a 40-bet sample at average odds of 18/1, even a 2% probability edge produces a meaningful positive return. The key is staking discipline — I never risk more than 0.5% of bankroll on a single HT/FT turnaround bet, and I treat the entire category as a high-variance satellite within my broader portfolio.
The profile of the favourite matters. I filter for teams with a strong second-half xG record — those generating 55% or more of their match xG after the break — and a history of conceding early away goals due to slow defensive starts. The match context also matters: a league fixture where the favourite has nothing to play for is unlikely to produce the intensity required for a second-half comeback. Matches with genuine stakes — a promotion race fixture, a local derby, a team fighting to stay in a European qualification spot — produce the emotional fuel that drives turnarounds. In-play betting accounts for more than 70% of UK sports wagers, and HT/FT bettors can complement their pre-match position by watching the first half unfold and laying off their exposure live if the match dynamics shift against the turnaround scenario.
For a complementary perspective on how goal-timing data feeds into other markets, the correct score guide uses the same Poisson framework to model specific scoreline probabilities rather than half-time states.
Why are half-time/full-time markets less efficient than match result?
The market has nine outcomes instead of three, which means the bookmaker must price six additional possibilities. The combined overround is typically 125-140%, far higher than the 103-106% on match result. That margin is distributed unevenly across the nine outcomes, and the outcomes attracting less public money — turnaround results like draw/home and away/home — are often priced with less precision. The complexity deters casual analysis, reducing the scrutiny that keeps prices accurate.
How do first-half and second-half goal rates differ?
Across the Premier League, approximately 44-46% of goals fall in the first half and 54-56% in the second half. This split is consistent season to season but varies by team. Some sides start aggressively and score early, while others improve after tactical adjustments at the break. These team-specific patterns are measurable over rolling samples and directly affect the probability of each half-time state in the HT/FT market.
Articles
Prepared by the Football Bet Today editorial staff.
