
Over 2.5 Goals Tips Today — Finding High-Scoring Fixtures
 Available in US
What the Totals Market Actually Measures
Three years ago I tracked every over 2.5 goals bet I placed across an entire season — 187 selections in total. My strike rate was 58%, which sounds decent until you realise the average implied probability from the odds I took was 56%. A 2% edge, compounded across 187 bets at flat stakes, produced a respectable but unspectacular profit. The takeaway was not that the totals market is easy — it is that precision matters more here than in almost any other football market.

The totals market — over and under a specified number of goals — is fundamentally different from match-result betting because it strips out the question of who wins. You do not need to identify the better team; you need to identify the right kind of match. That distinction changes the analytical toolkit entirely. Football betting generates roughly 5.8% of the UK population placing bets regularly, and the totals market draws a disproportionate share of those bets because it feels more predictable than picking a winner. Two attacking sides, open game, goals — straightforward, right?
Not quite. The 2.5-goal line exists because it sits close to the average goals per match across most European leagues — typically between 2.5 and 2.8 in the top five divisions. Bookmakers set it at this threshold precisely because it splits outcomes near the midpoint, creating a market where the public feels equally drawn to both sides. The real question is not “will there be goals?” but “which specific fixtures will deviate meaningfully from the average, and in which direction?” That requires looking at the right data.
I have spent the last six years refining a process that answers that question systematically. It starts with the five metrics that carry the most predictive weight for totals outcomes, moves through league-level baselines that most punters get wrong, and ends with a framework for choosing which goal line — 1.5, 2.5 or 3.5 — offers the best expected value for any given fixture. None of this guarantees every bet will land, but it shifts the probabilities in your favour consistently enough to produce a profit over time.
Five Metrics That Signal High-Scoring Matches
I used to rely on two metrics for totals analysis: goals scored and goals conceded per match. Then I spent a winter building a basic model and discovered those two metrics explained less than 40% of the variance in over 2.5 outcomes. The remaining 60% came from indicators most punters never check.
The first and most important metric is combined expected goals — the sum of both teams’ xG per match over their last eight fixtures. I use eight matches as a sample because it balances recency with statistical stability. A combined xG above 3.0 is the threshold I treat as a strong over 2.5 signal. Below 2.5 combined xG, I lean towards unders regardless of the actual goal tallies, because the underlying chance quality does not support sustained high scoring.
Second: PPDA — passes per defensive action. This measures how aggressively a team presses in the opponent’s half. Low PPDA (below 9.0) indicates a high-pressing side that forces turnovers in dangerous areas. When two low-PPDA teams meet, the match tends to be open and transitional — exactly the conditions that produce goals. I flag any fixture where both sides have a PPDA below 10.0 as a strong over-2.5 candidate. The UK’s remote casino, betting and bingo sector brought in 7.8 billion pounds in GGY to March 2025, and the sharp end of that market — the professional syndicates — use pressing metrics extensively. You should too.

Third: shot speed — the pace at which teams create chances. A team generating 14 shots per match but taking 90 minutes to accumulate them has a different goal profile from one generating 14 shots concentrated in bursts of three or four. Burst-shooting teams produce higher xG volatility, which correlates with more extreme scorelines — both high-scoring blowouts and frustrating 0-0 stalemates. I want burst shooters on both sides for an over-2.5 selection, because the probability of at least one burst producing a cluster of goals is high.
Fourth: time of first goal. Matches where the first goal arrives before the 25th minute are significantly more likely to produce over 2.5 total goals than matches where the deadlock persists into the second half. I cannot predict when the first goal will come pre-match, but I can assess the probability using each team’s average time to first goal scored. Two sides that typically score their first goal before the 30-minute mark create a fixture environment where the match opens up early — defenders chase, tactics shift, and goals follow.
Fifth: defensive transition speed. When a team loses the ball, how quickly do they reorganise? Slow transition teams leave space in behind for rapid counter-attacks. I look at goals conceded from counter-attacks as a percentage of total goals conceded — anything above 25% flags a team vulnerable to the exact type of chance that produces high-scoring matches. Two slow-transition sides facing each other is the dream over-2.5 scenario.
League-by-League Goal Averages — the 2.5 Threshold
One of the first things I do at the start of every season is recalibrate my league-level baselines, because the goal averages shift year to year — sometimes dramatically. The 2024-25 Premier League averaged 2.77 goals per match, down from 2.85 the previous season. That six-hundredths-of-a-goal difference might seem trivial, but it represents roughly 23 fewer goals across a 380-match season, and it is enough to shift over-2.5 hit rates by two to three percentage points.
The Bundesliga has been the highest-scoring top-five league for the last decade, averaging above 3.0 goals per match in most seasons. That means the 2.5-goal line is structurally generous for German football — over 2.5 lands in roughly 55-60% of Bundesliga fixtures. UK bookmakers know this, of course, and price accordingly: Bundesliga overs are typically tighter (lower odds) than equivalent Premier League fixtures. The edge in Germany is smaller per bet but more consistent, which makes it attractive for high-volume, flat-staking approaches.
The UK’s online gambling sector is growing at a compound rate of 12.8% annually through 2030, one of the fastest in European digital entertainment. That growth brings more recreational money into totals markets, which can create short-term pricing inefficiencies — especially in leagues where the public has a strong scoring perception that does not match reality. Ligue 1, for instance, is widely perceived as a low-scoring league, but its goal average has climbed above 2.7 in recent seasons, and overs in French football are frequently underpriced because the market has not updated its assumptions.
League Two is the outlier that I return to consistently. English fourth-tier football averages among the highest goals per match of any professional league in Europe — often above 2.9. Defensive quality is lower, squad depth is thinner, and fatigue effects are more pronounced across a 46-game season. Over 2.5 goals hits at 58-62% in League Two in most years, and the bookmaker pricing rarely reflects this fully because lower-league markets receive less analytical attention. If you are building a totals-focused strategy, League Two should be a core part of your fixture pool.

I keep a simple table updated weekly: league name, current season goal average, over-2.5 hit rate, and the average bookmaker implied probability for overs in that league. When the hit rate exceeds the implied probability by 3% or more, the league is in a value window and I increase my activity there. When the gap narrows or reverses, I pull back. This rolling recalibration keeps my approach anchored to current data rather than assumptions carried over from last season.
Over 2.5 vs Over 3.5 — When to Step Up the Line
The biggest mistake I made in my first two years of totals betting was sticking rigidly to the 2.5 line. Every selection was over 2.5 or under 2.5, as if no other number existed. Then I started analysing the 3.5 line and realised that for certain fixture profiles, stepping up to over 3.5 at bigger odds produced a higher expected value than the safer 2.5 bet — even though it won less often.
The key insight is that the probability drop from over 2.5 to over 3.5 is not uniform across all fixtures. In a low-xG match between two defensive sides, the drop might be 25 percentage points — say, 52% for over 2.5 down to 27% for over 3.5. The odds roughly double, but the probability more than halves: negative expected value on the step-up. In a high-xG fixture between two aggressive, leaky sides, the drop might be only 12-15 percentage points — from 65% to 50%. The odds again roughly double, but this time the probability drop is far smaller, creating positive expected value on the 3.5 line.
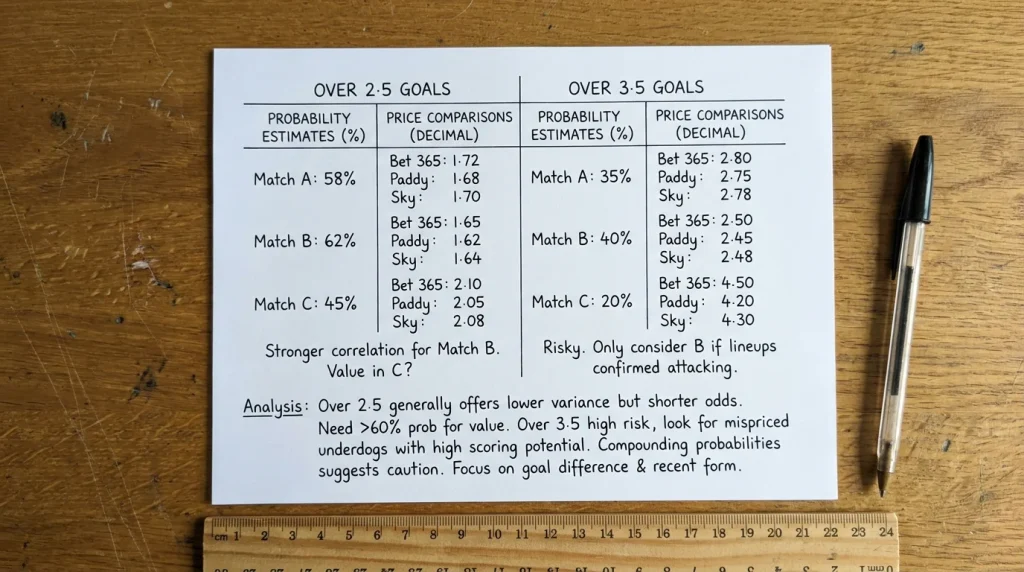
I use combined xG as the trigger for stepping up. If the combined xG of both sides exceeds 3.5 per match over the last eight fixtures, I seriously consider the over 3.5 line. Below 3.0 combined xG, I stay at 2.5 or pass entirely. In the range between 3.0 and 3.5, I compare the prices on both lines and take whichever offers the better expected value based on my probability estimate.
For those interested in the lower end of the totals market — over 1.5, which offers very low odds but a high strike rate — I have written a separate analysis on under 2.5 goals that covers the mirror side of this market in detail. The analytical framework is the same; only the direction changes.
One additional consideration when stepping up to over 3.5: the timing of goals matters more at higher lines. A match that is 2-0 at half-time has already cleared the 2.5 threshold with any second-half goal, but needs two more for over 3.5. That second-half dynamic — whether the leading team continues to press or sits back to protect the lead — is harder to predict pre-match. I factor in managerial tendencies here: some managers are relentless in chasing more goals regardless of the score, while others prioritise clean sheets once two goals ahead. The former group’s fixtures are far better over 3.5 candidates.
When Goals Cluster — First-Half vs Second-Half Data
Something I noticed three seasons ago changed how I think about totals entirely: goals do not distribute evenly across 90 minutes, and the clustering pattern is predictable enough to exploit.
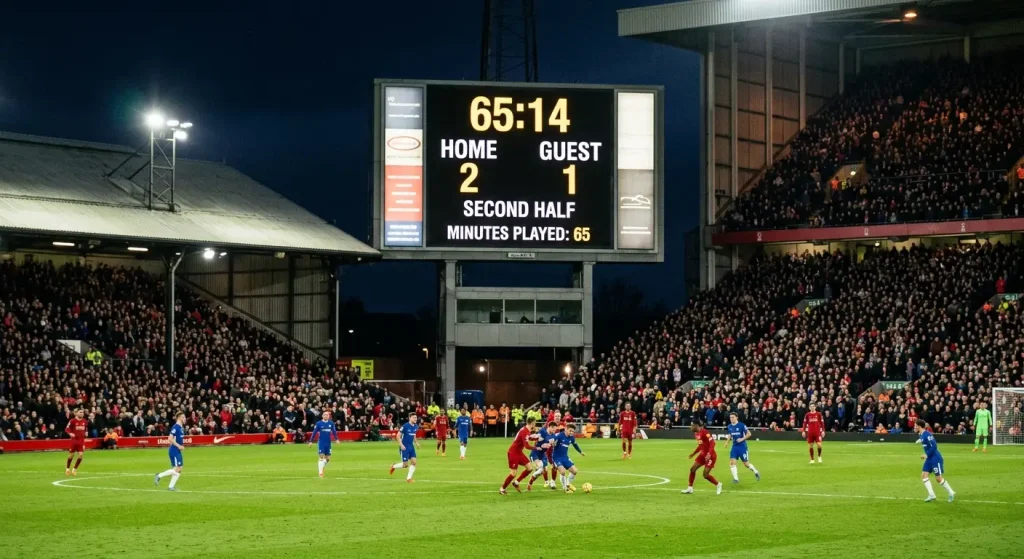
Across the Premier League, roughly 44% of goals come in the first half and 56% in the second. That split has been remarkably stable over the last decade. But at the fixture level, the variation is enormous. Some matchups — particularly those involving a strong home side against a mid-table away team — produce a disproportionate share of their goals in the first 30 minutes, as the home side comes out aggressively and establishes control early. Other matchups, especially those between evenly matched sides, remain tight until the 60th minute and then explode when one manager chases the game with attacking substitutions.
Over 70% of UK online sports bets are now placed in-play, which means you are not limited to pre-match totals bets. If the first half finishes 0-0 in a fixture you expected to produce goals, the in-play over 1.5 or over 2.5 price for the match can offer exceptional value — because the bookmaker’s live model reacts to the first-half scoreline while your pre-match analysis of the teams’ underlying chance quality has not changed. I have hit some of my best totals returns by waiting for a goalless first half in a high-xG fixture and then backing overs in-play at inflated prices.
The second-half goal surge is also linked to substitution patterns. Managers in the Premier League typically make their first substitution between the 55th and 65th minute, and the introduction of fresh attacking players disrupts the defensive shape that has held for the previous hour. I track which managers consistently bring on attackers before the 60th minute and which persist with the same setup until the 75th — the early changers produce more second-half goals, which feeds directly into totals analysis.
One practical application: if I have a strong over-2.5 lean but the pre-match price is too tight, I set an alert for the 60th minute. If the match is still goalless or 1-0 at that point, the in-play over-2.5 price has ballooned, and I take it — provided no significant tactical changes (a side going down to 10 men, a manager clearly parking the bus) have altered the picture. This patience has improved my totals ROI by roughly 3% per season, which over 150+ bets is substantial.
Reading Bookmaker Margins on Totals Markets
Every punter who has looked at an over 2.5 goals price has wondered the same thing: “Is that price actually fair?” The honest answer is that it is fair for the bookmaker. Understanding how margin is applied to totals markets gives you the final piece of the pricing puzzle.
Totals markets are typically two-way (over or under), which means the overround is simpler to calculate than a three-way match-result market. The implied probabilities of the over and under prices should, in a zero-margin market, sum to 100%. In practice, they sum to 105-108%, depending on the bookmaker and the fixture. That extra 5-8% is the bookmaker’s margin — the tax you pay for the privilege of placing the bet.
Here is what matters: bookmakers do not always apply margin evenly across both sides. In popular fixtures — a Saturday 3pm Premier League match, for example — the margin is often skewed towards the over side, because that is where the public money gravitates. The bookmaker shades the over price slightly worse (shorter) and the under price slightly better (longer) to manage their liability. This asymmetric margin application means that in high-liquidity fixtures, the under side often carries better underlying value than the implied probability suggests.

Major sporting events amplify this effect. With operators positioning for growth and the market expanding towards multi-product experiences, the volume of casual money on popular matches has never been higher. That casual money overwhelmingly backs overs — people bet on goals because goals are exciting. The sharper move in many fixtures is to assess the under side of the market, where the margin skew works in your favour. I am not saying “always back unders” — I am saying “always check whether the under price is being inflated by public bias towards overs.” Sometimes it is, and the free edge sitting there is real.
My process includes calculating the implied probability of both the over and the under, summing them, and isolating the margin. If the margin is above 7%, I look for the same fixture at a different bookmaker — margin variance between operators can be 2-3%, which translates directly into better expected value on the same bet. This comparison takes 30 seconds per selection and is one of the simplest value-adds in all of betting.
Frequently Asked Questions
How do combined xG totals translate to over 2.5 goals probability?
As a rough guide, a combined xG of 3.0 or above correlates with an over 2.5 probability in the 55-60% range across most leagues. Below 2.5 combined xG, the probability drops to around 40-45%. These are not exact conversions because xG distributions vary — a 3.0 combined xG built from many low-quality chances behaves differently from one built from a few high-quality chances. I use combined xG as a screening threshold, not a probability calculator.
Is over 2.5 goals a better bet in early or late season fixtures?
Late-season fixtures tend to produce slightly higher over 2.5 hit rates because relegation-threatened teams attack more desperately and promoted sides are already confirmed. However, the bookmaker adjusts pricing accordingly, so the value is not automatic. Early-season fixtures, when models are working with smaller samples, sometimes offer better pricing edges because the bookmaker"s confidence in its own numbers is lower.
Why do bookmakers adjust totals lines closer to kick-off?
Late price movements on totals markets reflect two things: team news and sharp money. A key attacking player being ruled out can shift the over 2.5 probability by 3-5%, and the bookmaker adjusts immediately once team sheets are confirmed. Sharp bettors — professional syndicates and high-volume punters — also place their bets close to kick-off, and their activity moves the line further. If you see the over 2.5 price drifting (becoming longer) close to kick-off, it typically means sharp money is on the under.
Articles
Created by the "Football Bet Today" editorial team.
