
Under 2.5 Goals Tips Today — When Defences Dictate the Scoreline
 Available in US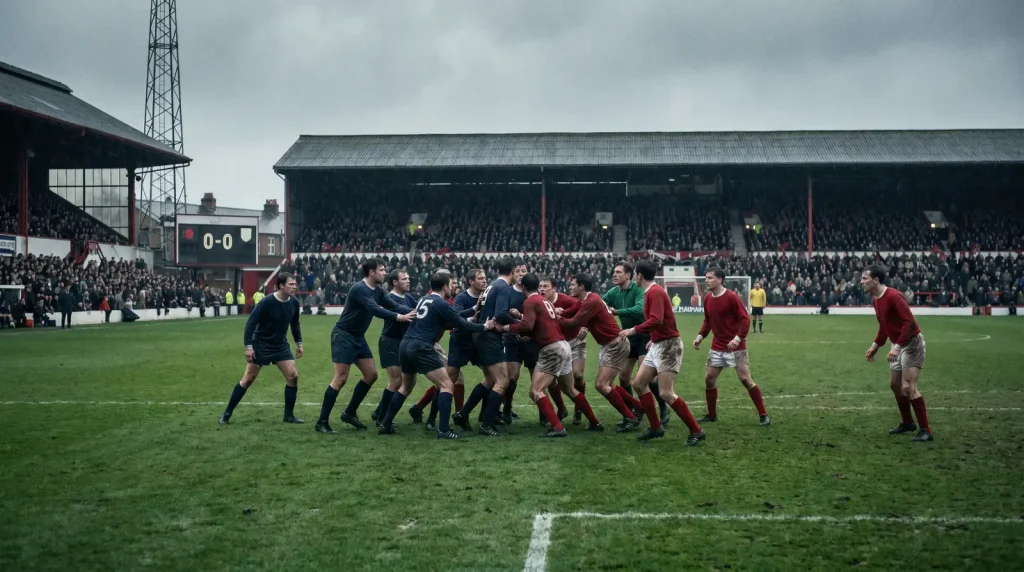
Under 2.5 Goals — the Overlooked Side of the Totals Market
Every football punter I know has a natural bias toward goals. We want to bet on action, on excitement, on matches that light up. That psychological tilt toward overs is one of the most profitable things about the unders market — because when the crowd zigs, the smart money zags.
Football remains the most popular sport for UK betting, generating £1.1 billion in gross gaming yield annually, and the totals market captures a significant share of that volume. But the money flows disproportionately toward over 2.5 goals. Punters want goals. Bookmakers know punters want goals. The result is a systematic pricing asymmetry: overs are often slightly overpriced to meet demand, and unders are slightly underpriced because fewer people want to bet on a dull 0-0. That structural inefficiency is subtle — a percentage point here, a percentage point there — but across hundreds of bets it compounds into a real edge.

I track my under 2.5 goals bets separately from other markets, and they have been my most consistently profitable category over the past four seasons. Not because the wins are exciting — they are not — but because the maths works quietly in your favour when the rest of the market is looking elsewhere.
Defensive Metrics That Signal Low-Scoring Fixtures
A match landing under 2.5 goals requires at most two goals across both teams in 90 minutes. That outcome is driven primarily by defensive quality, not attacking weakness. Two bad teams who cannot score might produce a 0-0, but they might also produce a scrappy 3-2 where errors lead to goals. Genuine unders candidates are matches where at least one team — preferably both — actively prevents high-quality chances.
The remote betting sector generated £2.6 billion in gross gaming yield from sports betting alone in the year to March 2025, with football accounting for half of that. The volume of data available for analysing defensive performance is enormous, and three metrics consistently predict low-scoring outcomes better than any others.

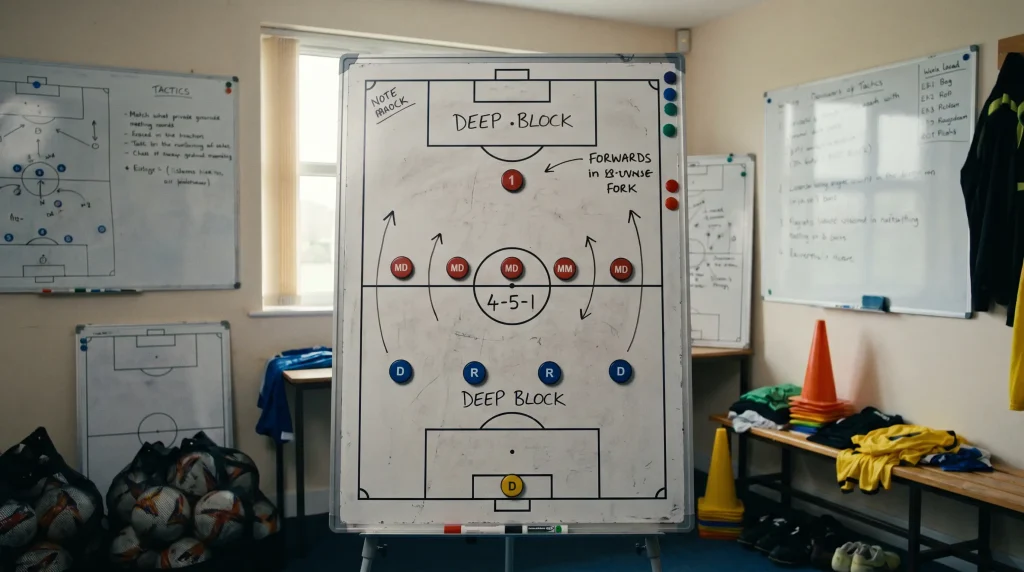
First, xGA per match on a rolling eight-to-ten-match basis. Teams conceding fewer than 1.0 xGA per match are genuine defensive units. When two such teams meet, the combined expected goals for the fixture sits comfortably below 2.5, and the unders price frequently offers value. Second, shots conceded inside the box — a granular measure of how well a team prevents opponents from reaching dangerous shooting positions. A team allowing fewer than four shots inside the box per match is defending structurally, not relying on saves. Third, PPDA in defensive contexts. Teams with high PPDA — meaning they defend deep rather than pressing high — tend to produce matches with fewer total shots, fewer total xG, and fewer goals. When two deep-defending teams meet, the match tempo drops and the unders probability rises.
Situational Angles — Dead Rubbers, Derbies and Caution
Numbers tell you a lot, but context tells you the rest. Some of my best under 2.5 bets have come from situational reads that no statistical model captures cleanly.
Dead rubbers in mid-table are the most obvious angle. Two teams with nothing to play for in the final six weeks of the season produce cautious, low-intensity football. Managers rest key players, motivation drops, and the match drifts toward 0-0 or 1-0. The bookmaker’s totals line still reflects the team’s season-long averages rather than the immediate context, creating a gap.

Local derbies are less intuitive. You might expect derbies to be high-scoring because of the intensity, but the data says otherwise. Derby matches across the top four English divisions tend to produce fewer goals than the league average. The reason is tactical caution — managers fear losing a derby more than they desire winning one, so they set up conservatively. The atmosphere raises the stakes, the players are more combative, the referee is more cautious with decisions, and the result is often a tight, low-scoring affair. When two historically cautious derby rivals meet, the unders price is often longer than it should be because casual punters assume intensity equals goals.
End-of-season relegation battles follow a similar pattern. Teams fighting for survival prioritise not losing over winning. They sit deeper, play more conservatively, and accept a draw rather than risking an open game. When two relegation-threatened sides meet, the under 2.5 market frequently offers genuine value.
Why Bookmakers Often Underprice Overs (and What That Means for Unders)
I mentioned the pricing asymmetry earlier, and it is worth unpacking why it exists in more detail, because understanding the mechanism helps you exploit it more precisely.
Bookmakers are businesses. Their pricing is influenced by two forces: the model’s estimate of true probability and the flow of customer money. When money floods onto overs — because punters want goals — the bookmaker has two choices. They can either hold the price and accept the imbalanced liability, or they can shorten the overs price to slow the money and lengthen the unders price to attract balancing bets. Most bookmakers do the latter, because balanced books are lower risk. The result is that unders odds are often 5-10% longer than the model’s raw probability would suggest. That extra length is your edge.
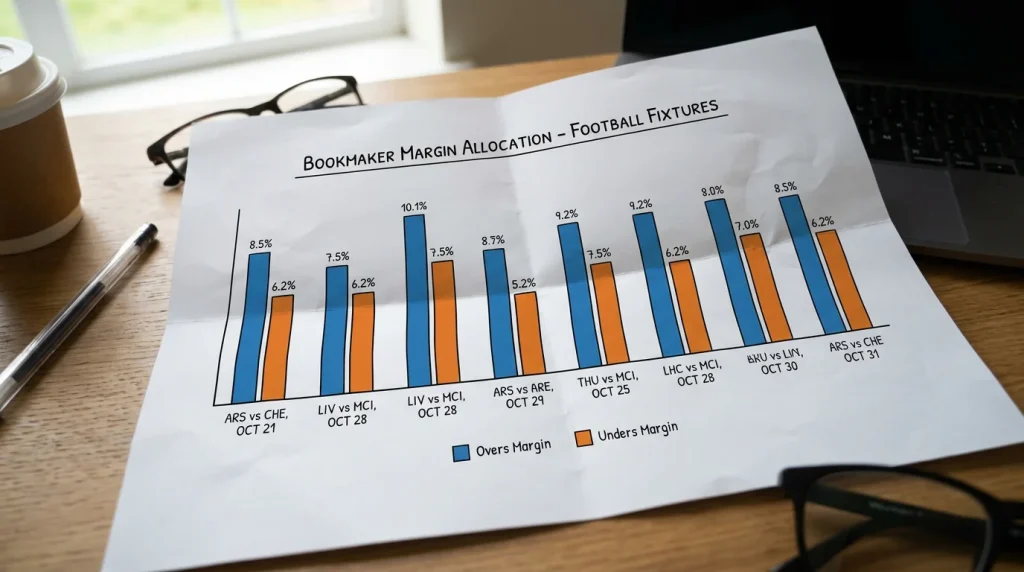
This effect is strongest in high-profile matches — Premier League televised fixtures, Champions League ties, international matches — where casual betting volume is highest and the bias toward overs is most pronounced. In lower-league fixtures with smaller betting volumes, the asymmetry is weaker because the money is more evenly distributed. I focus my unders betting on the higher-profile fixtures specifically because the pricing inefficiency is largest there.
The connection to the over 2.5 goals analysis is direct — the same pricing dynamics that create value in overs when defensive metrics are weak create mirror-image value in unders when defensive metrics are strong. The two markets are opposite sides of the same coin, and the edges come from understanding which side the public money is distorting.
Which league positions tend to produce the most under 2.5 results?
Mid-table teams with nothing to play for and relegation-threatened teams prioritising survival produce the highest rates of under 2.5 results. In the Premier League, matches between teams ranked 10th to 16th historically produce under 2.5 goals approximately 50-55% of the time, compared to about 45% for the league overall.
How does fixture context like a relegation battle affect total goals?
Relegation battles increase tactical caution. Teams fighting to stay up tend to defend deeper, accept draws more readily, and avoid the open, expansive play that produces high-scoring matches. When two relegation-threatened sides meet, the under 2.5 goals rate rises significantly — often to 55-60% — because both managers prioritise not losing over winning.
Articles
Prepared by the Football Bet Today editorial staff.
